Hematology Analysis System
Frequently Asked Questions
1. Each reagent package must be examined before use. Product integrity may be compromised in packages that have been damaged. Inspect the package for the signs of leakage or moisture. If there is evidence of leakage or improper handling, do not use the reagent.
2. Pay attention to the expiration dates and open-container stability days of all the reagents. Be sure not to use expired reagents.
3. Pay attention to the storage temperature of the reagent (different reagents have different requirements, so you need to refer to the reagent label)
4. Do not ingest any reagent. In case of ingestion, seek medical attention promptly.
4.1. Avoid contact with skin. In case of contact, rinse the affected area immediately with ample amount of clean water.
4.2. Avoid contact with eyes. In case of contact, rinse the affected eye immediately with ample amount of clean water and seek medical attention promptly.
Generally, there are two types of expiration dates of reagents:
One is the storage expiration date of the reagent, that is, the final date on which the reagent can be stored under normal storage conditions (without opening the container);
The other is the open-container expiration date of the reagent, that is, the number of days during which the reagent can be used after the container is opened.
Different reagents have different storage expiration dates and open-container expiration dates, as well as different storage and use temperature requirements. You need to refer to the label or instructions manual of the specific reagent.
Aging samples in medical laboratory science refer to specimens (e.g., blood, urine, tissues) subjected to simulated long-term storage, temperature variations, or environmental exposure to evaluate the stability of testing methods, result reliability, and optimal sample preservation conditions. The goal is to ensure accuracy and reproducibility in laboratory diagnostics. (Key standards: CLSI EP25-A, ISO 15189.) If the sample storage time last too long which samples already exceed the capacity of the test system. This kind of samples name aging samples.
The Unit of NRBC%: %, /100WBC, no unit. We should know NRBC doesn’t belong to WBC.
Where the following is present, the PLT count may be reported falsely low:
- Platelet clump
- Giant platelet
Where the following is present, the PLT count may be reported falsely high:
- Microcytosis
- RBC fragment
- Cryoglobulin
The “rules of three” of RBC-related parameters can be found in the CLSI H26-A2 document. The rules are as follows:
3 (RBC) = HGB (eg.5 million・3= 15 g/dL [150 g/L])
3(HGB) = HCT (eg.10 g/dL [100 g/L] ·3 = 30%)
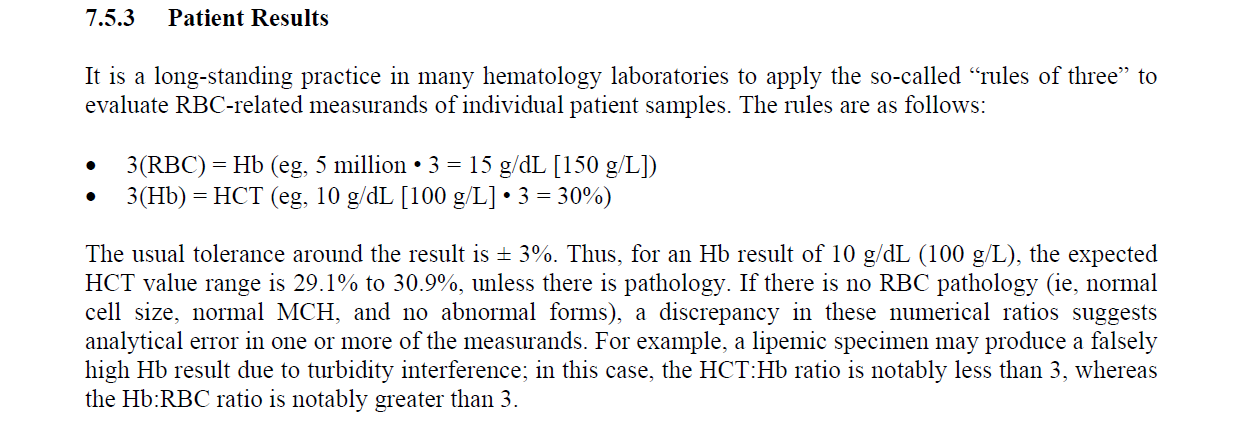
It is a long-standing practice in many hematology laboratories to apply the so-called “rules of three” to evaluate RBC-related measurands of individual patient samples.
The usual tolerance around the result is ± 3%. Thus, for an Hb result of 10 g/dL (100 g/L), the expected HCT value range is 29.1% to 30.9%, unless there is pathology. If there is no RBC pathology (i.e., normal cell size, normal MCH, and no abnormal forms), a discrepancy in these numerical ratios suggests analytical error in one or more of the measurands. For example, a lipemic specimen may produce a falsely high Hb result due to turbidity interference; in this case, the HCT: HGB ratio is notably less than 3, whereas the HGB: RBC ratio is notably greater than 3. At this point, the test results are unreliable and require further confirmation to eliminate interference.
The “rules of three” of RBC-related parameters can be used by doctors to review and judge test results, but it is important to pay attention to their application scope. When abnormal situations occur, smear microscopy detection or manual counting or other methods should be combined with instrument alarm information for confirmation.
Auto-validation Gray Area refer to samples with mild abnormalities that do not directly trigger re-run or smear but require manual review for further evaluation. In Mindray’s labXpert, such samples are categorized as Gray Area samples and correspond to the Review module in Auto-validation.
There are three levels, designated as BC-BF, with 6 batches annually, each expiring on the 10th day of the odd-numbered months.
Mindray has matching ESR quality control materials, which include two levels: high (abnormal value) and low (normal value). The target values for ESR parameter quality control are assigned to the BC-6D hematology quality control materials at the L (low) and N (normal) levels. Specifically, the low-level hematology quality control material of BC-6D is assigned a high ESR value, while the normal-level hematology quality control material is assigned a low ESR value.
The BC-6D quality control materials can be for combined testing and monitoring of blood routine and ESR parameters. It should be noted that combined testing requires setting the quality control testing mode to “CD+ESR mode.” In this mode, the sample volume consumption of quality control materials will increase. Therefore, during quality control testing, attention need to be paid to the volume of the quality control materials to avoid abnormal out-of-control results caused by insufficient sampling.
The Mindray 6-part differential analyzers utilize flow cytometry to perform WBC 5-part differentiation (neutrophils, lymphocytes, monocytes, eosinophils, basophils), with extended capability to analyze specialized parameters such as HFC (High Fluorescent Cells, e.g., atypical lymphocytes/blast cells) and IMG (Immature Granulocytes). In contrast, BC-3D/BC-5D controls—designed for 3-part/5-part systems—contain simulated particles that only cover basic classification targets (BC-3D: lymphocytes/monocytes/granulocytes; BC-5D adds eosinophils/basophils). These controls lack fluorescence signature characterization for HFC/IMG and other advanced parameters, rendering them insufficient for quality control monitoring of the extended analytical capabilities in 6-part systems.
We strongly recommend using Mindray’s dedicated BC-6D quality control product, which is calibrated based on the instrument’s algorithm characteristics and provides target value assignments specific to different models. This ensures the traceability of the detection system and consistency of the results. If, due to special circumstances, the BC-6D quality control product is unavailable, third-party six-part differential quality control products may be used. However, Mindray does not take responsibility for the results or stability of third-party quality control products. When using third-party quality control products, priority should be given to those that are algorithmically compatible and have preassigned target values specifically for Mindray models. If such preassigned target values are not available, it is necessary to conduct parallel quality control experiments to establish laboratory-specific target values before use.
The deviation limit in the Mindray hematology quality control target value sheet is not the standard deviation of the quality control target value.
The allowable deviation range of Mindray hematology QC material parameters is established through evaluation of inter-laboratory variations, inherent method variability, and known biological variability of the control material. By synthesizing the relative uncertainty components introduced by various influencing factors, the total relative standard uncertainty Urel is obtained, which further calculates the extended uncertainty U (Extended Uncertainty):
U(Extended Uncertainty) = Urel*C*k
The allowable deviation ranges for the quality control material are set not to exceed the expanded uncertainty at k = 3.
The deviation limit in the Mindray hematology QC target value sheet can be used to determine whether the quality control results are normal. If the QC results exceed the allowable deviation range, it is necessary to investigate and determine whether the QC out of control is caused by abnormal QC materials, QC testing errors, instrument failures, etc. If the laboratory needs to set the range of quality control SD, it can establish the target values and SD range of each detection parameter by accumulating targets on its own.
Analyze new lots of control material in parallel with current lots before the expiration date of the current lots. To transition to a new lot of control material, proceed as follows:
- Set up empty QC files for each control level of the new lot. When the values for the new lot are confirmed and updated information entered, these files are used for the remainder of the dating period.
- Verify the new lot of control material by running each level of control three times in its respective file. Ensure that the mean values of the three runs for each measurand fall within the ranges shown
on the manufacturer’s assay sheet, without particular regard to matching any published “mean” value. - Run each level twice a day for three to five days to calculate new mean values for each measurand.
- Compare the calculated mean values for each level to the range specified on the manufacturer’s package insert.
- If the calculated mean falls within the specified range, enter it as the expected mean instead of any value on the manufacturer’s package insert.
When a single quality control result is out of control, typically we need to retest the quality control sample and simultaneously analyze whether it’s a single-parameter or multi-parameter out-of-control. Multi-parameter outliers usually correspond to operational issues. If it’s a single-parameter outlier and still remains out of control after retesting, we recommend conducting another test using a new vial, while also checking if there are any abnormalities in the sample results to confirm the status of the reagents and the instrument. Analyze the trend of the quality control results; if the outliers are due to a trending increase or decrease, the necessity of calibration should be considered. Finally, after completing all troubleshooting steps, copy the INF file for HQ analysis.
Because the reference ranges of the parameters (MCV/MCH/MCHC) employed in X-B quality control vary across different populations and are influenced by factors such as region, altitude, and atmospheric pressure, the X-B quality control settings on labXpert are based on reference intervals established for the Chinese population and may therefore not be applicable to other regions worldwide. If X-B quality control is to be utilized in other regions, it is recommended to determine and modify the reference intervals according to the local population.
Quality control material failure can be identified using the following three methods:
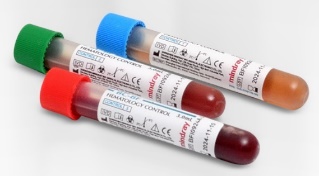
Visual Inspection: Normal quality control material should appear as a homogeneous bright red liquid with no precipitation or layering. Deteriorated samples often exhibit brownish-black discoloration, and obvious layering may be observed after overnight standing.
RBC Histogram Analysis: The histogram of normal quality control material should resemble that of healthy human samples, showing a single-peak symmetric distribution. Deteriorated samples may display abnormal peak shapes, such as: Elevated front peak (indicating low-temperature storage). Tailing rear peak (indicating high-temperature exposure).
RDW Monitoring: As a sensitive indicator of red blood cell volume heterogeneity, the RDW value of normal quality control material should fall within the target range. In deteriorated samples, RDW often increases significantly due to red blood cell shrinkage or swelling.
Innolab HCP is a platform that uses Mindray IQC to implement daily EQA functionality. It aggregates QC results from different customers using the same equipment models and Mindray control materials to calculate group means and assess individual clients’ daily QC deviations. Additionally, it can generate monthly reports.
Yes. Mindray has RET calibrator. Engineer can conduct RET Gain calibration or routine calibrator calibration to BC-6 series.
The main factors to consider are three aspects:
- Instrument system bias: Caused by systematic instrument errors, which can be corrected through instrument calibration;
- QC settings and execution: Missing QC configuration or failure to execute QC runs, requiring corrective actions in QC setup;
- Other factors: Such as interference from sample matrices or reagents, or degradation of control materials.
MCHC (Mean Corpuscular Hemoglobin Concentration) is a calculated parameter derived from RBC (Red Blood Cell count), MCV (Mean Corpuscular Volume), and HGB (Hemoglobin concentration) using the formula: MCHC = (HGB×1000)/ (RBC×MCV). In cases of abnormal MCHC results, it is recommended to first verify the accuracy of RBC, MCV, and HGB measurements.
Yes, it can refer to CLSI H20-A2 “Reference leukocyte (WBC) differential count (proportional) and evaluation of instrument methods”, which outlines comparison protocols and criteria for evaluation.
Refer to ICSH recommendations for the standardization of nomenclature and grading of peripheral blood cell morphological features. Microscopy is indispensable for qualitative morphology, rare cell detection, and confirming automated flags. Automated instruments excel in rapid, quantitative analysis but rely on microscopy for nuanced interpretation. Collaboration between both methods ensures optimal diagnostic accuracy.
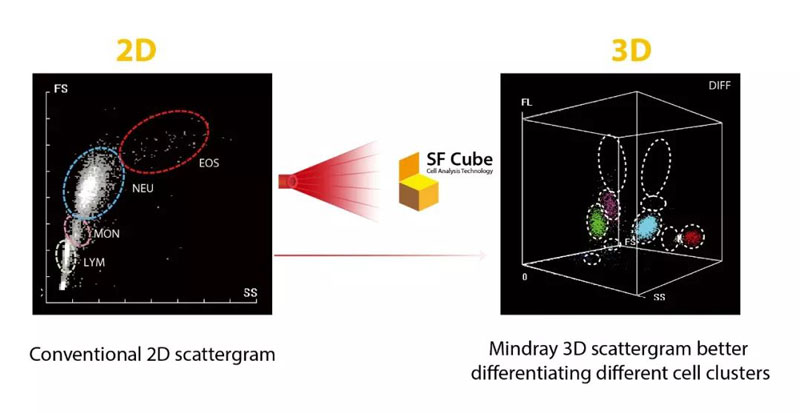
SF Cube is an innovative technology of blood cell analysis for Reticulocytes, NRBCs and WBC 5-Diff counts, with effective flagging of abnormal cells such as Atypical Lymphocytes and Blast Cells, as well as RBC Fragments and Lipid Particles.
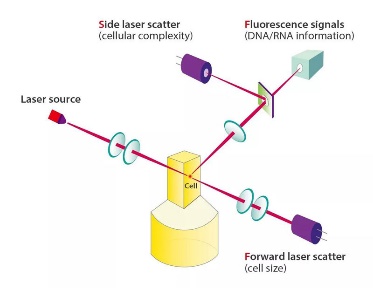
By interaction with reagents, target cells are subject to 3D analysis using bi-angular Laser Scatter Signals and Fluorescence, thus the name SF Cube. The 3D scattergram generated with the cellular information -- namely its size (forward laser scatter), complexity (side laser scatter), and DNA/RNA information (fluorescence) -- can help clinical experts to identify and differentiate cell populations.
(Reference: Small Cube, Big Difference: Mindray New SF Cube Technology (I))
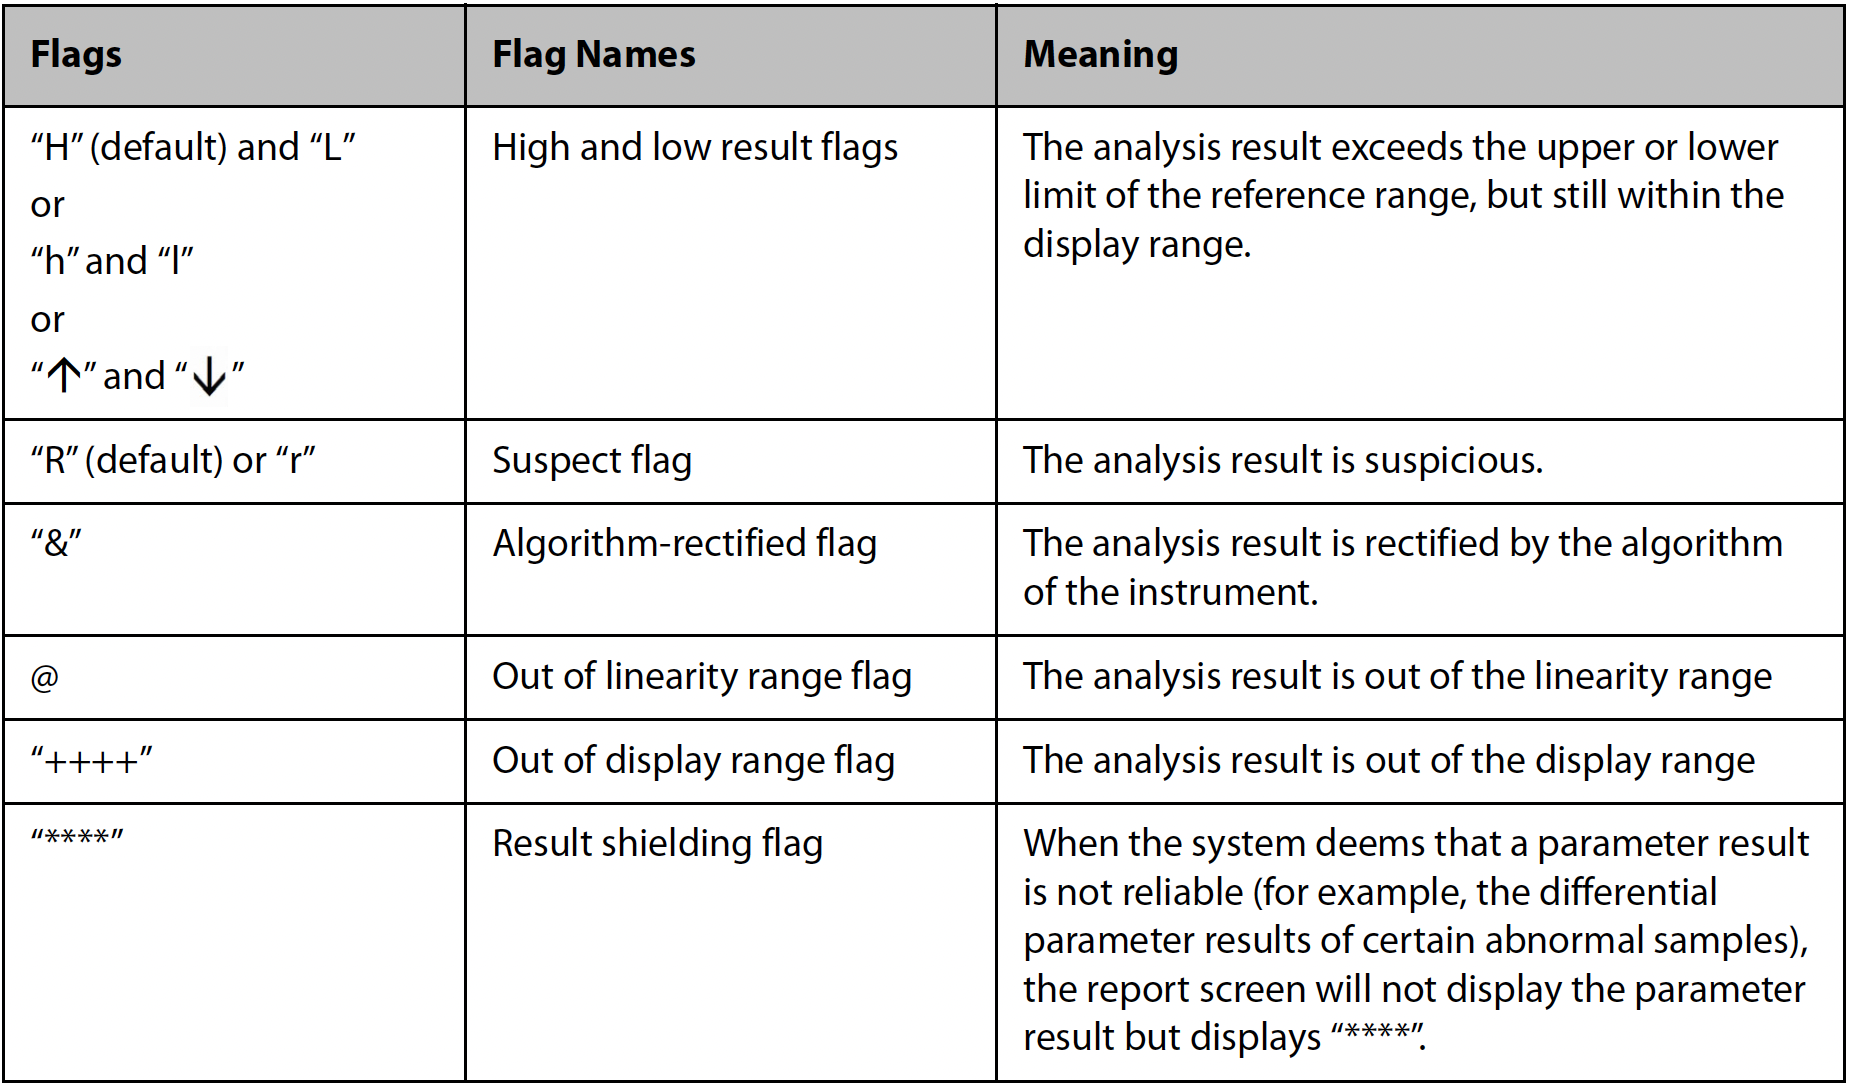
Upon completion of analysis, Mindray hematology analyzers will annotate specific flags adjacent to relevant parameters based on instrument performance, algorithms, and configuration settings. Please refer to the following illustrated symbols and their corresponding interpretations.
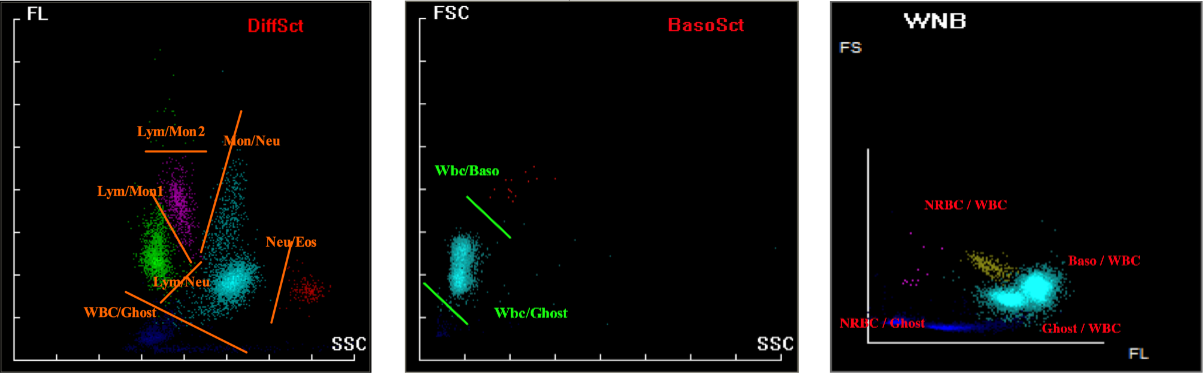
Using the SF Cube platform, normal peripheral blood samples can be algorithmically classified into distinct cell populations with clear boundaries. However, when morphological changes occur in peripheral blood cells—such as increased granules, enlarged volume, or a rise in abnormal cell counts—the cell populations on the scatter plot may exhibit positional shifts or expanded areas, leading to blurred boundaries between cell groups. When boundaries are abnormal, the corresponding particle cluster-related parameters are flagged with an “R.” If boundaries severely overlap, the results for those particle cluster-related parameters are blocked. According to the International Consensus Group for Hematology Review Criteria or the requirements of an accredited laboratory, such samples should undergo microscopic review to avoid erroneous result reporting.
When Mindray hematology analyzers withhold test results while other brands still provide data, this does not indicate inferior algorithm capability, but rather stems from different design philosophies and quality control standards. Mindray employs the SF Cube 3D analysis platform, whose intelligent algorithm actively withholds questionable results when detecting blurred cell population boundaries (such as scatter plot shifts or overlaps caused by abnormal cell morphology). This strategy actually reflects higher quality requirements.
While other brands may choose to report borderline results, Mindray prioritizes data reliability by implementing mandatory review mechanisms to prevent potential erroneous reporting. In such cases, it is recommended to perform manual microscopic review according to protocols, which not only complies with laboratory accreditation requirements but also ensures the accuracy of final reports.
Mindray’s BC-6000 and BC-700 series hematology analyzers have a minimum reportable value of 1000 cells/μL for RBC in body fluid samples, with results below this threshold reported as 0, which is consistent with the technical specifications of comparable products. We recommend pre-test visual assessment of sample characteristics: instrument testing may be used for pink/red samples (indicating higher RBC count), while colorless/clear samples (suggesting lower RBC count) should be analyzed by manual microscopic counting. Notably, the new BC-7800 analyzer launching in 2025 features an hs-BF high-sensitivity mode with a detection limit (LoD) of <10 cells/μL, which will significantly improve the detection capability for low-concentration RBC in body fluids.
The PLT/RBC histogram is derived from the impedance channel of the hematology analyzer. The instrument collects real-time pulse signals generated by each cell particle passing through the detection hole, records its volume (fL) and quantity, and forms volume quantity distribution data to form a histogram.
Therefore, the phenomenon of elevated tail of platelet histogram indicates that particles or signals beyond the normal platelet volume range are detected in the impedance channel, reflecting abnormalities or detection interference of sample, leading to abnormal platelet histogram. Common abnormal situations and their causes may include: an increase in large platelets, a high proportion of immature platelets, platelet aggregation, a high number of small red blood cells, interference from red blood cell debris, cryoglobulin or lipid particles, etc., which can cause the tail of the PLT histogram to rise and even lead to false PLT results.
The Mindray BC-6 Series and BC-7 Series have instruments with Ret channels that can be used for optical detection of PLT, thereby reducing the interference of abnormal samples and obtaining relatively accurate PLT results. For severely abnormal samples, it is necessary to conduct slide microscopy to confirm the interference situation and results of the samples.
Abnormal platelet histograms are usually triggered by factors such as microcytes, red blood cell fragments, large platelets, or platelet aggregation. These cases should be handled based on specific circumstances. If no corrective measures are taken, it is not recommended to report platelet results from the hematology analyzer. Instead, manual microscopy should be performed to exclude interfering factors before reporting.
If the RET channel is used for correction and the corrected platelet count falls within the normal range, re-examination is not required. However, the influencing factors should be noted in the report for clinical reference. If the count remains below the lower limit of the reference range, manual microscopy is recommended to confirm the actual platelet count of the sample.
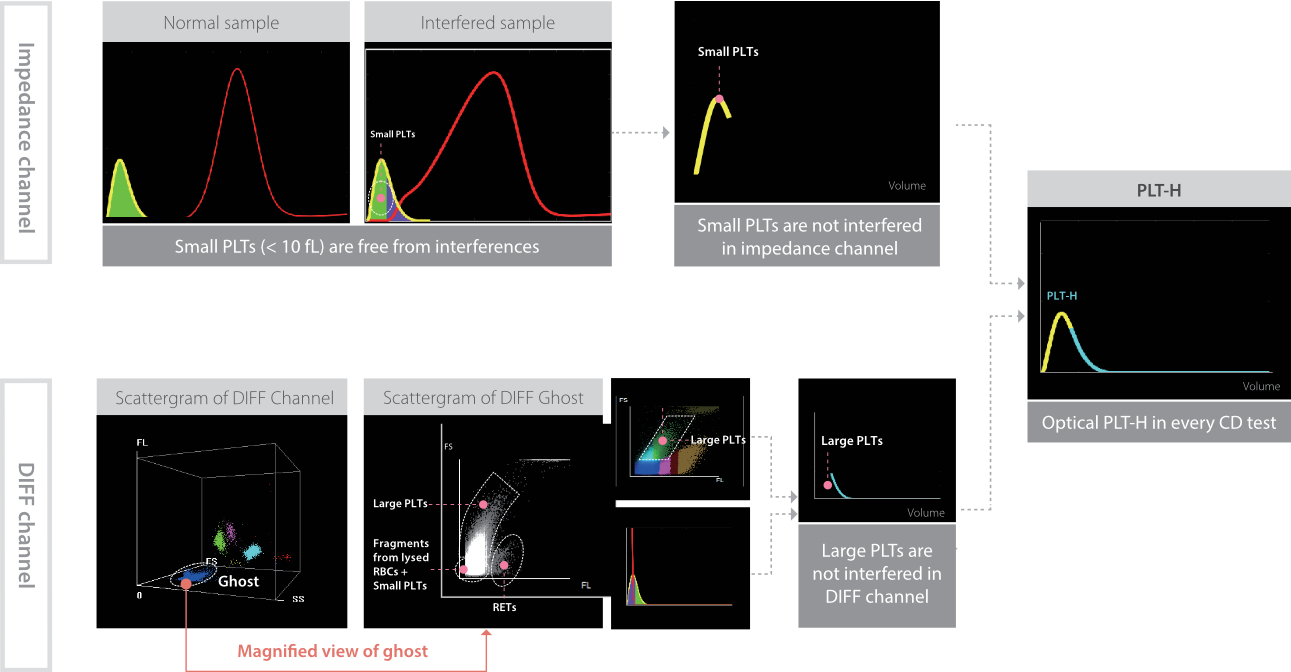
The principle of PLT-H involves combining two methods:
Impedance channel: Detects small platelets (PLTs) without interference from microcytic RBCs or fragments.
DIFF channel: Uses specific reagents to dissolve RBCs while preserving PLT integrity, enabling precise optical detection of large PLTs.
By integrating small PLTs from the impedance method and large PLTs from the optical method, PLT-H ensures accurate platelet counting.
PLT-H improves the accuracy of PLT counts in scenarios where microcytic RBCs, cellular fragments and giant PLT may interfere with traditional impedance-based methods.
(Reference: Hemabook Chapter 18: PLT-H: A new parameter for accurate platelet counting with anti-interference ability; Auto Hematology Analyzer with ESR BC-700 Series)
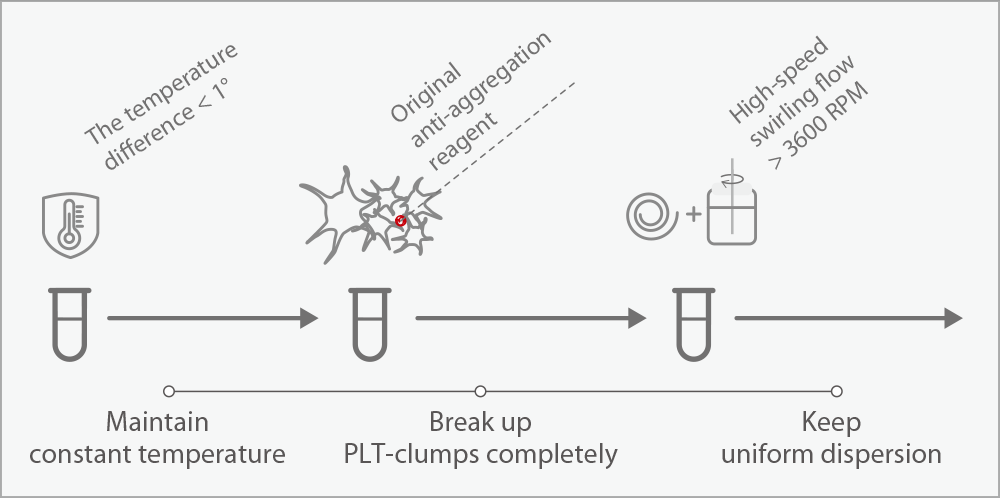
The PLT-O channel employs a dual-mechanism disaggregation process: samples are mixed with specialized reagent and subjected to 3600 rpm vortex agitation at 42°C, effectively dispersing aggregates into individual platelets for optical detection (reported as PLT-O). While this method demonstrates high efficiency in routine testing, complete (100%) disaggregation cannot be guaranteed. Optimal performance requires testing within 30 minutes post-collection. For severely aggregated samples, manual microscopic review remains necessary as a complementary method.
First, check whether both the calibration results and QC results are normal. If the QC results are stable and within the acceptable range after calibration, it indicates that there are no issues with the instrument’s status. You can also visually inspect whether there is any shift or aggregation in the particle clusters. If a minor shift in the particle clusters occurs, the instrument’s algorithm will automatically correct it and report the results. However, if the shift is too large, it will affect the results. In such cases, optical gain calibration of the instrument should be performed.
During sample test procedure, the analyzer predicts WBC results. When the predicted result is lower than the set threshold, the analyzer automatically lengthens the test duration in the DIFF channel to 3 times that of a normal test to obtain 3 times particles in the normal test mode.
The CDR mode and CDR/PLT-8X mode in the RET channel can both be used to disaggregate platelet aggregation.
CDR mode: This is suitable for samples with relatively high platelet counts and where clear platelet interference can be observed from histograms or other alarms.
PLT-8X mode: By extending the detection time in the RET channel by 8 times, this mode provides more accurate platelet results. It is designed for samples with low platelet counts and no obvious interfering factors, to determine if the low platelet count is genuine.
Usually, RET type 1 or 2 refer to HFR, type 2 or 3 refer to MFR, Type 4 refer to LFR.
Generally, large platelets refer to immature platelets. The distinction is: P-LCR (Platelet-Large Cell Ratio) is derived from the impedance channel. IPF (Immature Platelet Fraction) is measured via the fluorescence channel. The IPF method, using fluorescence technology, has stronger anti-interference capability compared to the impedance-based P-LCR.
The BC-780 is different from other instruments in the 6-series lineup in that the NRBC parameter is calculated through an algorithm within the DIFF scattergram.
First, it is necessary to confirm the microscopy inspection method with the client. If manual microscopy inspection is being performed, it is required to count and classify at least 200 white blood cells. If it is confirmed that the high false positive rate is due to excessively low instrument thresholds, it is recommended to conduct statistical analysis on the data. After modifying the I-message value, perform validation.
The parameter MCV of Mindray hematology analyzer refers to the average volume of RBCs, which is used to evaluate the average size of RBCs. The result is calculated based on the RBC histogram, which can be understood as the horizontal axis of the RBC histogram representing the size of different RBCs, and the vertical axis representing the frequency of detection of each size of RBCs in the impedance channel, thus calculating MCV=∑ RBC volume/∑ RBC particle number.
The parameter HF-MCV, which is the highest frequency RBC volume, corresponds to the volume value of the highest frequency in the RBC histogram, as shown in the figure:
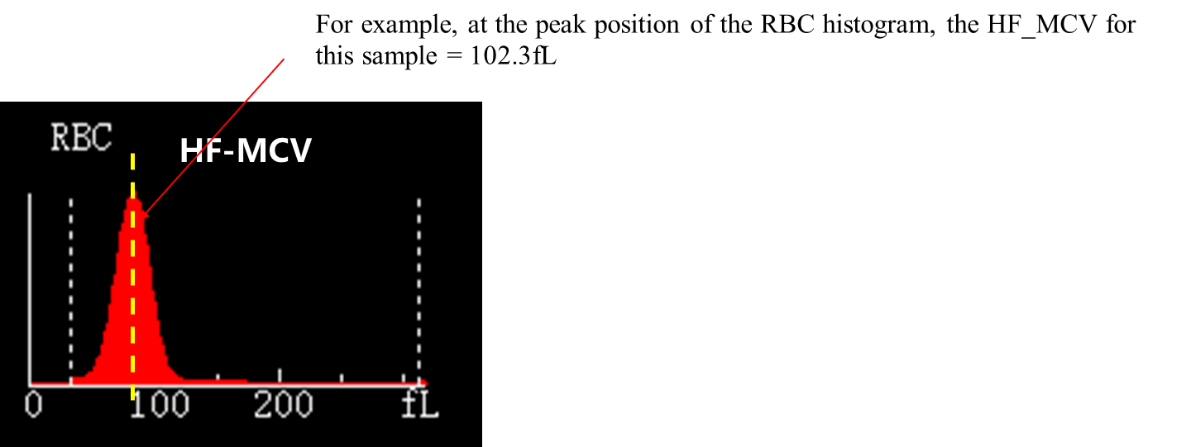
When encountering cold aggregated samples or other abnormal samples, it can be used for the evaluation and reference of sample MCV.
The hematology analyzer has two parameters that describe the distribution width of PLT, one is PDW and the other is PDW-SD.
1. There is no unified standard for PDW parameters internationally, and the calculation methods are independently developed by various manufacturers. There are differences in the calculation principles of PDW among different manufacturers. PDW is 10 times the geometric standard deviation (10GSD), without units, and the actual units are similar to ABBOTT.
The volume distribution histogram of PLT is generally skewed towards a normal distribution, often described as a log normal distribution. That is to say, the distribution of PLT volume measurement values after log processing is a quasi-normal distribution.
The characteristics of PLT histogram and RBC histogram differ significantly. RBC follows a normal distribution, while PLT follows a skewed distribution. The method of calculating RDW-SD is suitable for calculating the width of normal distribution, but its ability to characterize skewed distribution is limited. Therefore, manufacturers such as Mindray and Abbott have chosen the geometric standard deviation, which is more suitable for estimating skewed distributions, as the basic calculation method for PDW.
2. The calculation methods for PDW-SD and RDW-SD are similar:
PDW-SD=coefficient * standard deviation of platelet histogram
This method is similar to Sysmex’s calculation method; therefore, it has good consistency with Sysmex’s PDW parameters.
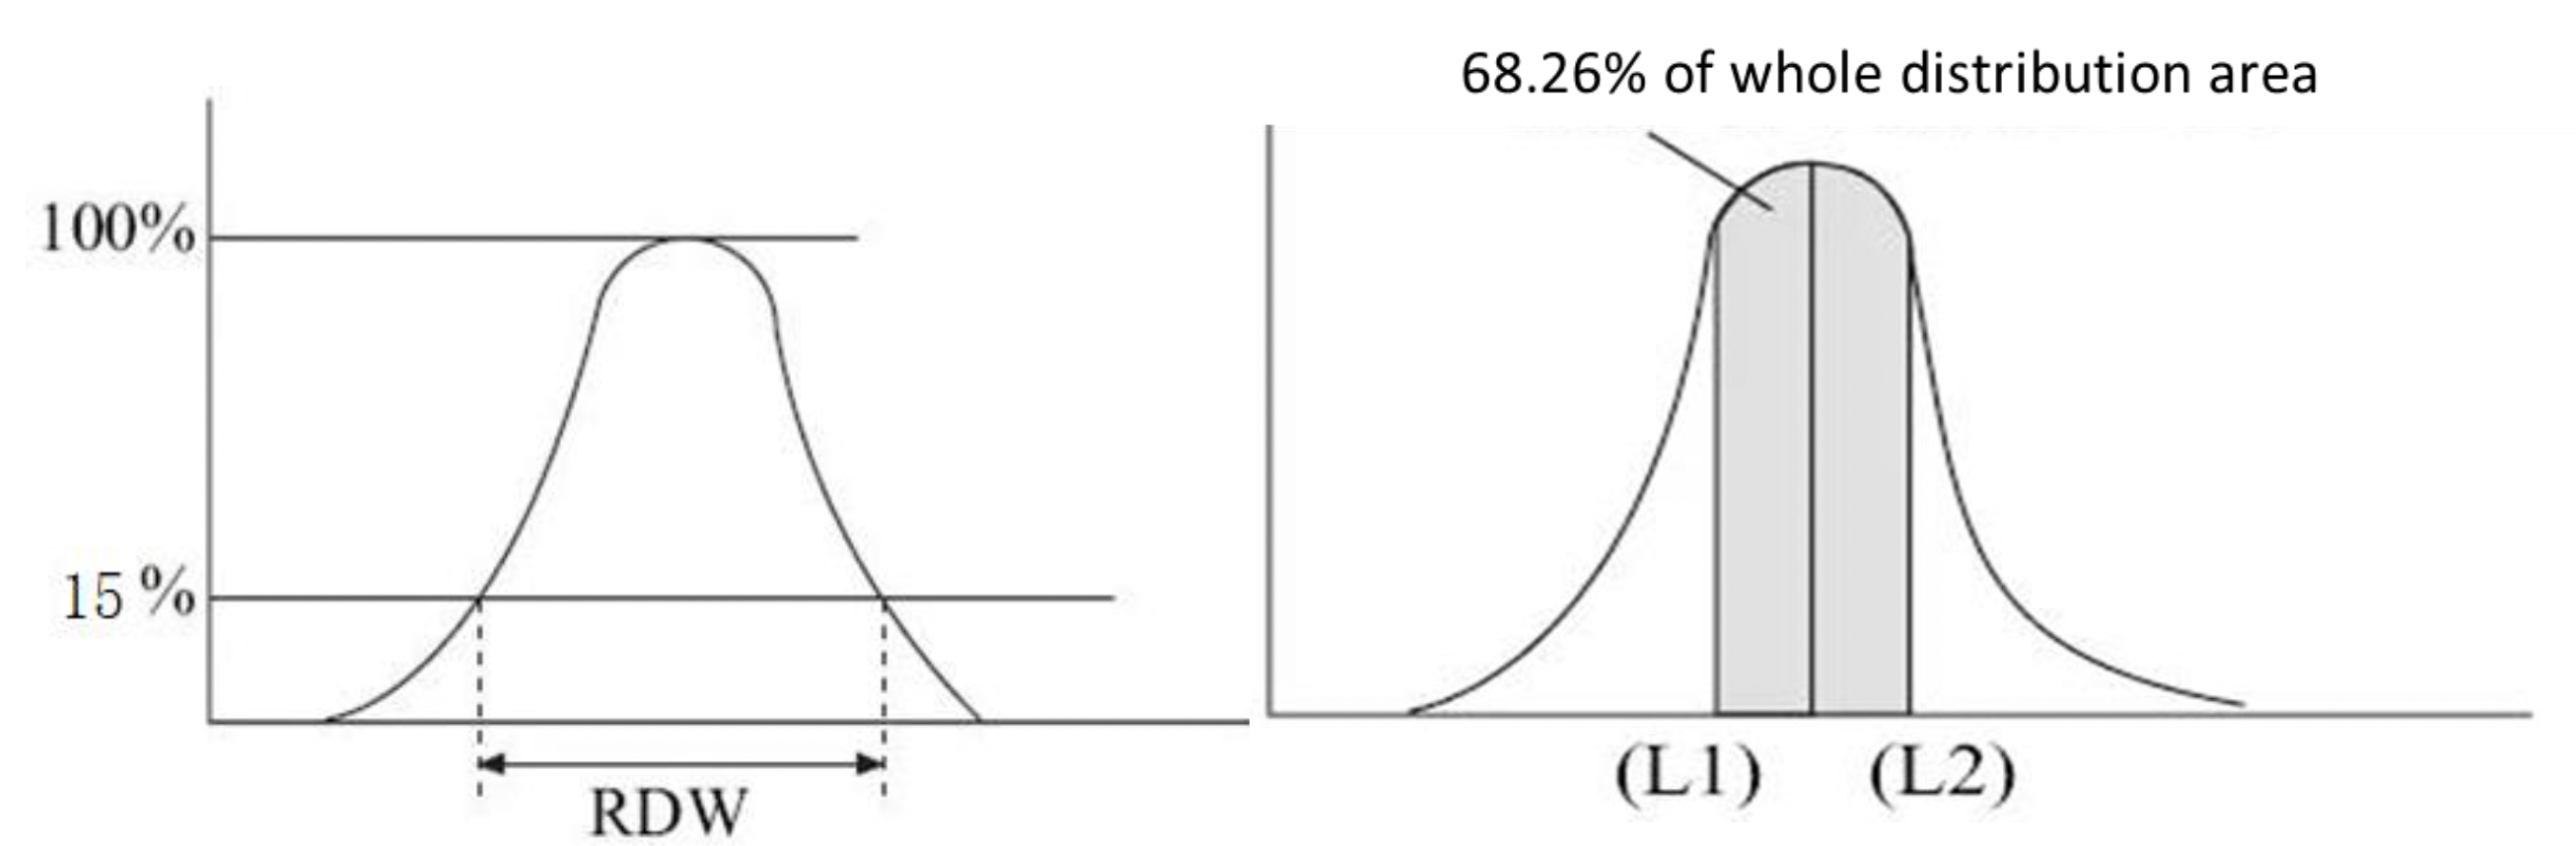
The principle of RDW (Red Cell Distribution Width) detection by the Mindray instruments is based on statistical analysis of the red blood cell volume histogram, achieved through two methods: RDW-SD (Standard Deviation) uses the peak height of the RBC histogram as the 100% reference and measures the difference in red blood cell volume (in fL) between two points where the histogram height drops to 15%, directly reflecting the absolute dispersion of RBC volume distribution; RDW-CV (Coefficient of Variation) determines two volume thresholds, L1 and L2, on the histogram, ensuring the region between them covers 68.26% of red blood cells (equivalent to the mean ±1 standard deviation in a normal distribution), and calculates the result using the formula (L2-L1)/(L2+L1)*100%, expressing the relative variation in RBC volume as a percentage. Note that RDW-CV and RDW-SD are not the same concepts as the statistical SD and CV. When RDW-SD and RDW-CV results are abnormal, it may be advisable to contact service engineer to check the calibration status of MCV-G.
The impact varies across different analyzers, primarily determined by detection principles. Since lipid particles exhibit weak fluorescence responses, WBC results derived from fluorescence channels remain unaffected. For example, Does WBC count get affected by hyperlipidemia?
The impact varies across different analyzers, primarily determined by detection principles. Since lipid particles exhibit weak fluorescence responses, WBC results derived from fluorescence channels remain unaffected. For example:
BC-6800PLUS/BC-6000: WBC counts from the WNB channel
BC-700: WBC counts from the DIFF channel
Otherwise, results may be influenced by hyperlipidemia.
NRBC falsely high refers to a situation where the instrument’s test results report higher NRBC (nucleated red blood cell) counts than those confirmed by the gold-standard reference method (e.g., manual microscopy). This discrepancy typically arises from systematic errors or the presence of interfering factors.
Mindray BC - 6 series employs the Florence platform, which can eliminate nucleated red blood cells (NRBCs). When encountering NRBCs, there is no need to manually correct the white blood cell (WBC) results.
Nucleated Red Blood Cells (NRBCs) are immature red blood cells characterized by an unexecuted nucleus that exists in the early stages of red blood cell formation. Under normal circumstances, these types of cells only exist in the bone marrow and are released into the peripheral blood after maturation (enucleation). If NRBCs are detected in the peripheral blood of adults, it usually indicates a pathological state or certain special physiological conditions. Newborns (especially premature infants) may briefly experience NRBCs, which is a physiological phenomenon.
The nuclear cytoplasmic ratio of NRBCs is high and there is no granule. Their diameter is similar to that of lymphocytes. Due to the working principle of automated blood analyzers and the similarity in cell morphology between NRBCs and lymphocytes, the presence of NRBCs can affect the counting and classification of white blood cells (WBC). The main reason is that the automated analyzer uses fluorescence staining technology to distinguish cell types based on differences in cell volume and internal structure (particle size, staining characteristics). Due to the similarity between NRBC and Lym structures, the instrument algorithm is difficult to distinguish, and NRBC may be mistakenly identified as “small lymphocytes” and included in the total WBC count, resulting in a false increase in WBC and an artificially high lymphocyte ratio, which may affect the classification ratio results of other cells and may present as abnormal scattergram. So, in samples with NRBC, there may be a false increase in uncorrected WBC counts, which may mask the true disease (such as WBC reduction) or be misdiagnosed as infection, leukemia, etc., leading to unnecessary testing or treatment.
Therefore, correction of WBC results is essential. At present, various models of Mindray have dedicated channels for detecting NRBC, which can automatically calibrate the instrument algorithm after detecting NRBC, and obtain accurate WBC counting and classification results. If the instrument does not have the ability to detect NRBC, manual slide microscopy can be performed based on alarms or reminders to manually count the number of NRBC and obtain the correct WBC and classification results. The formula is:
Corrected WBC=instrument report WBC * 100/100+NRBC percentage
Through precise correction, misdiagnosis as lymphocytosis or masking of true infections/hematological diseases can be avoided, ensuring the accuracy of clinical decision-making.
Identify: Appearance is sand-like;MCHC high, RBC and HCT low, RBC histogram abn. etc.
Re-exam rules set: HF-MCV differ from MCV, RBC-O differ from RBC, MCHC > 380g/L etc.
Action: Plasma exchange; Warm bath/ 37℃ incubation;+RET test
Report: MCHC recovery lower than 360g/L
After capturing images of WBC in peripheral blood smears, the MC-80 extracts from the captured cell images the characteristics of colors, texture and geometry, so as to obtain the “eigenvector” that represents the cell classes: the color characteristics represent the colors of WBC nucleus, cytoplasm and granule; the texture characteristics represent the fineness of the chromatin, the presence of the nucleolus and the cytoplasm granularity in the nucleus; and the geometric characteristics represent the size, shape and roundness of the nucleus and cytoplasm. Therefore, each WBC image has a group of eigenvectors. Then MC-80 will perform algorithm processing based on the obtained feature vectors to determine the cell class of the cell image.
In practical applications, due to different dye brands, staining conditions, sample states, and other factors, the color, morphology, and other characteristics of white blood cells may change. The feature vectors extracted by the instrument may have similarities with the characteristics of the wrong cell category, leading to misclassification. For example, in samples with a high proportion of aging cells and abnormal cells, there are more cases of abnormal white blood cells in the sample, which increases the probability of misclassification of WBC.
Under normal conditions, the MC-80’s white blood cell pre-classification recognition accuracy for fresh blood samples did not reach 100% accuracy, whether in terms of claimed performance or actual validation data. Therefore, there were a small number of misclassifications caused by algorithm recognition, but the instrument was still able to record the image information of these white blood cells for doctors to identify and confirm. In the labXpert software, doctors only need to view the morphology of each WBC cell and confirm the classification results. The software supports manual adjustment of misclassified WBC images. Only after the morphological results are reviewed and validated by the doctor can the morphological results be sent. As a blood cell morphology analyzer, MC-80 is convenient for doctors to automate the reading and recording of cell images, without the need to manually change the field of view and manually classify and count. Customers only need to view the images on the software side to complete the confirmation of WBC morphology, greatly saving labor and improving work efficiency.
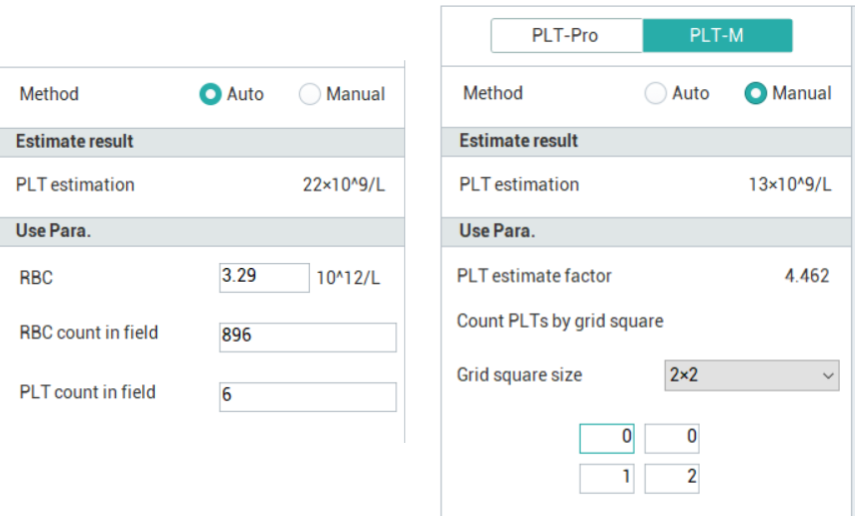
Mindray PLT-M has Auto and Manual.
Auto PLT-M=(PLT/RBC) under microscopy ×RBC from CBC
Manual PLT-M=(PLT)) under microscopy ×PLT estimate factor
First, observe the staining status to check for any abnormal staining issues. If abnormalities are detected, adjustments to the staining protocol of the SC-120 instrument need to be made. Once normal staining is confirmed, you may advise the client to conduct a performance verification of the MC-80 instrument. If the performance requirements are met, explain this situation to the client. If the performance requirements are not fulfilled, copy the relevant data and seek assistance from the HQ to identify the root cause of the issue.
Theoretically, the SC-120 can stain any cells compatible with the Giemsa staining principle. However, we currently do not claim that the instrument is suitable for staining bone marrow or body fluid samples, nor do we provide recommended staining protocols.
Customers may adjust the staining protocol based on the existing blood smear staining performance to accommodate bone marrow smears and body fluid samples, creating a customized staining protocol. However, the instrument does not guarantee the staining results for these sample types.
The SC-120 only conducts viscosity testing on whole blood samples. For microvolume blood samples, it uses the default smearing level 8 for slide preparation.
Before smearing, the SC-120 performs viscosity testing on whole blood samples and combines this with the sample’s HCT value to comprehensively determine key parameters such as blood droplet volume, smear angle, and speed. This ensures that different samples achieve similar blood smear length and thickness.
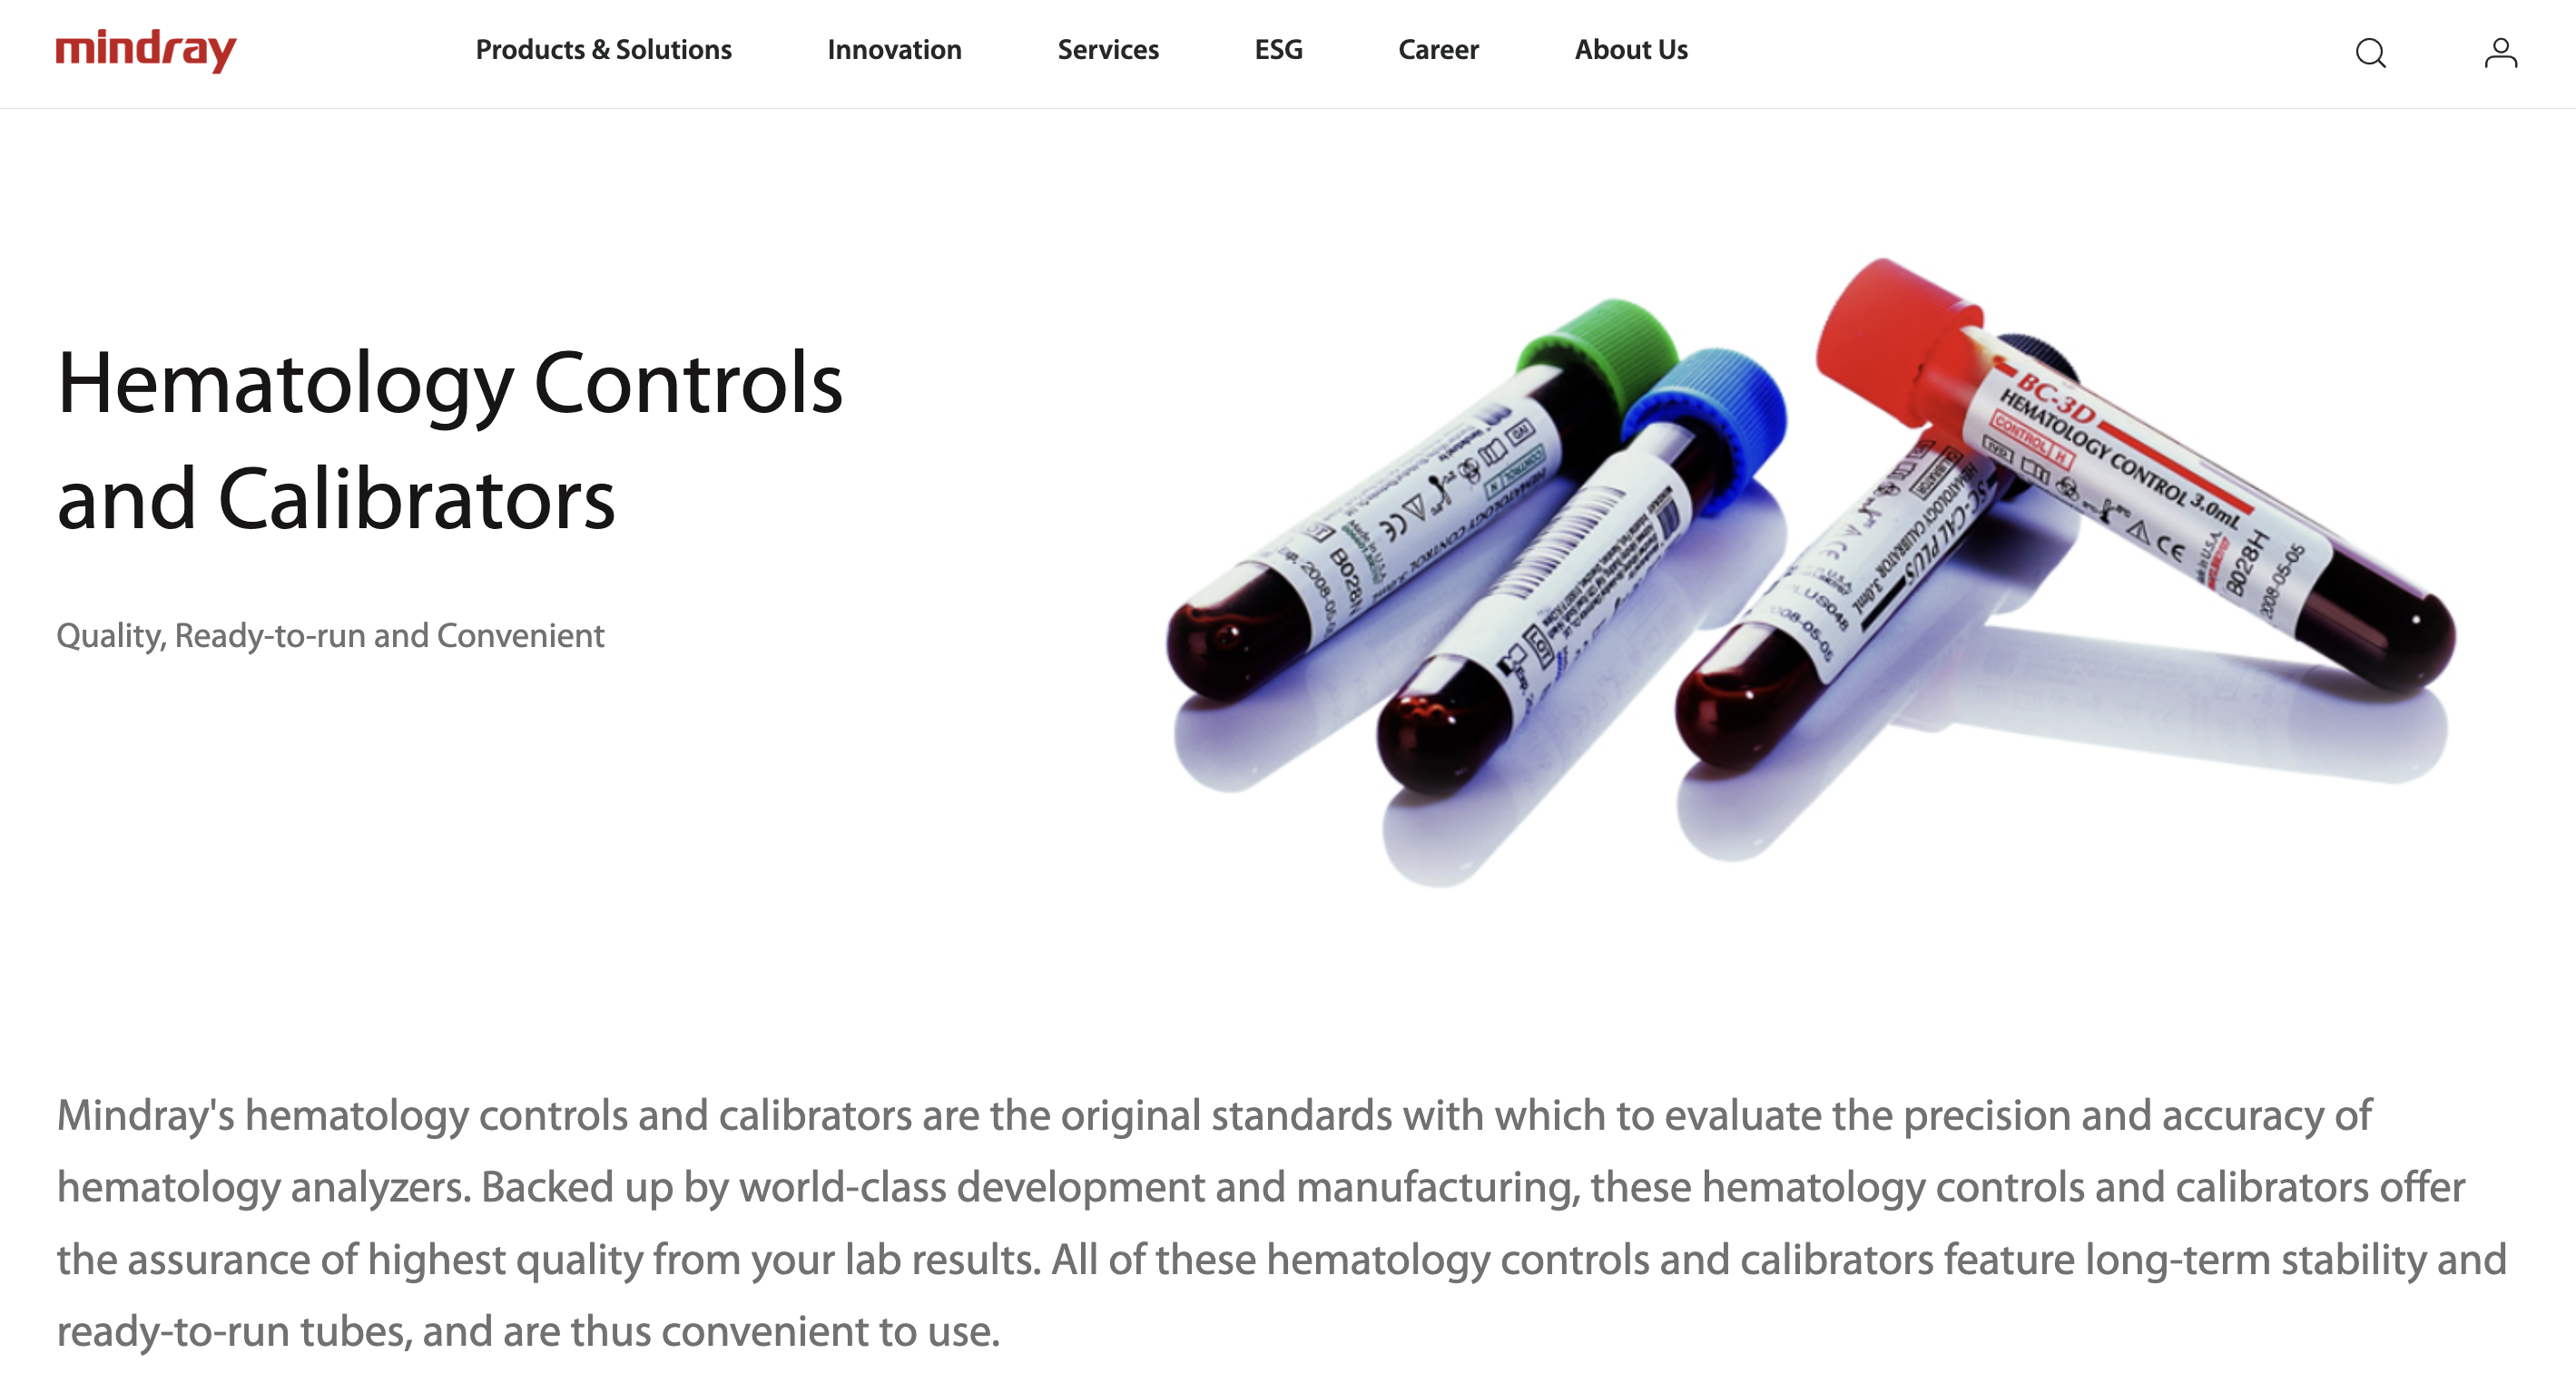
Mindray offers hematology controls tailored for 3-part, 5-part, and 6-part differential analyzers, namely BC-3D, BC-5D, and BC-6D, respectively. For 6-part analyzers, Mindray also provides specific controls for reticulocyte parameters (BC-RET) and body fluid parameters (BC-BF). Target values for all control types can be downloaded from the official Mindray website. For more information, please visit: https://www.mindray.com/en/products/laboratory-diagnostics/reagents/hematology.
The target value files for the BC-6D blood routine control and reticulocyte control provided by Mindray include target value sheets, MQI files, and QR codes. The BC-5D control has target value sheets and MQI files, while the control for body fluid parameters only has target value sheets.
There are multiple ways to enter the quality control target values. For customers with the labXpert software:
Method 1: In the QC setting interface of the software, in the target value setting area, manually enter the values according to the target values and limitation of each parameter on the target value sheet, and save the values after confirming they are correct.
Method 2: Save the quality control target value MQI file in the computer or in a USB flash drive and insert the USB drive into the computer. In the software QC setting interface, click the “Read File” ![]() function key, select the quality control MQI file that you want to enter into the quality control LOT level. After confirmation, the target values of each parameter will be automatically entered.
function key, select the quality control MQI file that you want to enter into the quality control LOT level. After confirmation, the target values of each parameter will be automatically entered.
Method 3: In the QC setting interface of the software, use the mouse to click and select a blank quality control file location. Use a two-dimensional barcode scanner to scan the quality control QR code. After the scanning and recognition are completed, the quality control target values will be automatically entered. (The barcode scanner configured for the hematology analyzer is a one-dimensional barcode scanner and cannot recognize QR codes. A two-dimensional barcode scanner needs to be configured separately.)
Tip: If the configuration connected to labXpert is a multi-instrument assembly line, after completing the entry of the quality control target values for one instrument, you can use the “Copy” ![]() function in the QC setting interface of the software to copy the configured quality control file to other instruments. There is no need to re-enter the quality control target values of this LOT for other instruments. In addition, once the instrument is connected to labXpert, it can only perform QC settings through labXpert.
function in the QC setting interface of the software to copy the configured quality control file to other instruments. There is no need to re-enter the quality control target values of this LOT for other instruments. In addition, once the instrument is connected to labXpert, it can only perform QC settings through labXpert.
For customers who only have a standalone hematology analyzer without the software:
Method 1: In the QC setting interface of the instrument, in the target value setting area, manually enter the values according to the target values and limitation of each parameter on the target value sheet, and save the values after confirming they are correct.
Method 2: Save the quality control target value MQI file in a USB flash drive and insert it into the analyzer. In the instrument QC setting interface, click the “Import File” function button. The instrument will automatically search for and recognize the quality control MQI file, and the target values of each parameter will be automatically entered after completion.
It is recommended to centrifuge the sample at 1,500–2,000 rpm for 5–10 minutes, then collect the supernatant for machine-based detection. If the supernatant cannot be collected, it is advised not to proceed with machine-based detection but to perform manual counting instead.
Mindray hematology analyzers employ different predilution ratios across series: The BC-6000, BC-6200, BC-700 series and BC-7600 models use a recommended 20:100 ratio (whole blood/capillary blood to diluent), while the BC-6800 and BC-6800Plus models adopt a 40:140 ratio.
It is normal. One of the highlights of the BC-700 series products is the improved experience of probe cleanser maintenance operations.
Other online hematology products require probe cleanser maintenance every time they are turned off or at scheduled maintenance times, which takes approximately 15 minutes. For BC-700 series products, manual maintenance is not required when the instrument is turned off, and the instrument automatically cleans 3-4 minutes and shuts down. There is no need to perform daily maintenance every day. The instrument defaults to a 7-day interval or when the cumulative analysis sample size exceeds the threshold, the probe cleanser maintenance operation will only be reminded during the scheduled daily maintenance time. Greatly reduces the manual maintenance and upkeep operations for customers, improving their user experience.
For the WBC/PLT, it is recommended to use centrifuged samples, with centrifugation conditions similar to those for coagulation samples. Extract the leukocyte and platelet layers to prepare high-value leukocyte and platelet samples.
For the RBC/HGB/MCV, it is recommended to collect 3-4 samples of fresh whole blood, manually discard the plasma, and mix the samples. If conditions allow, it is advisable to check the blood type and ensure consistency before proceeding, as inconsistent blood types may lead to hemolysis and agglutination, which could affect the performance validation results.
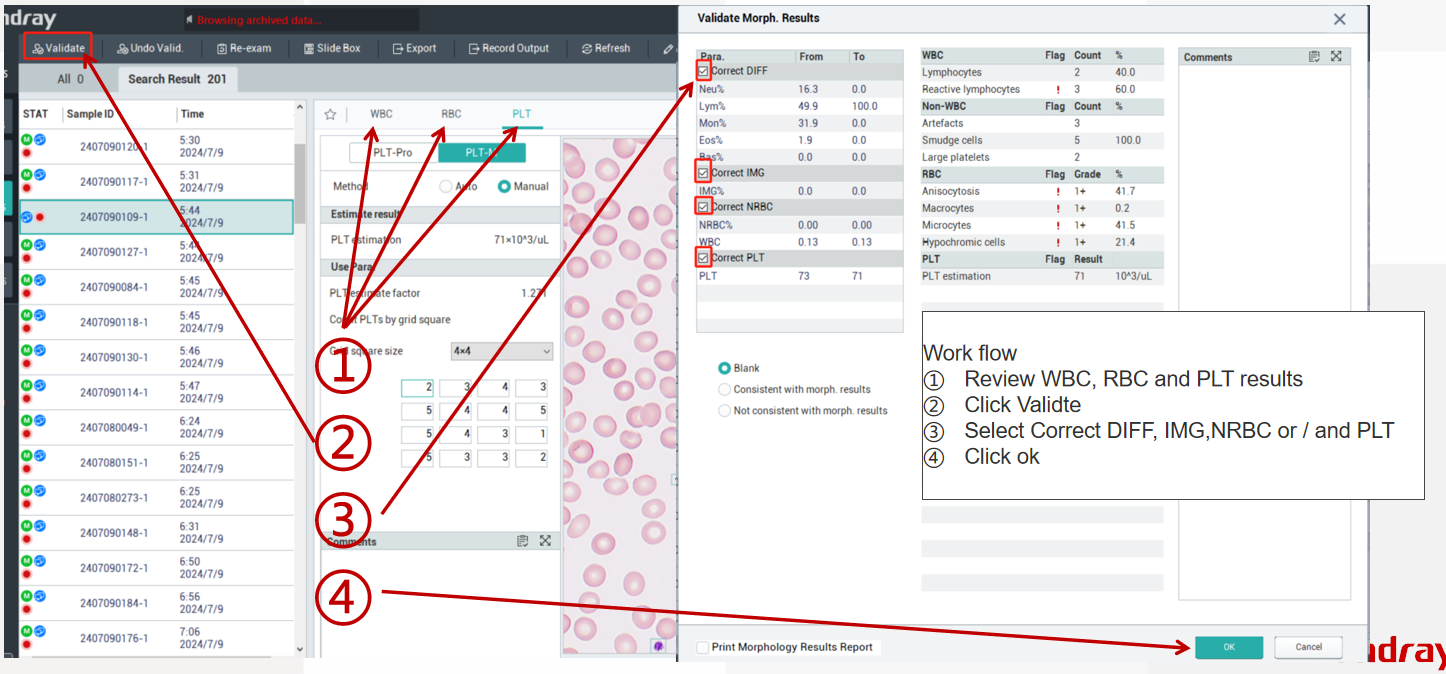
First, perform the corresponding settings, then follow the steps. Once validated, the MC-80 results can be used to correct the CBC results.
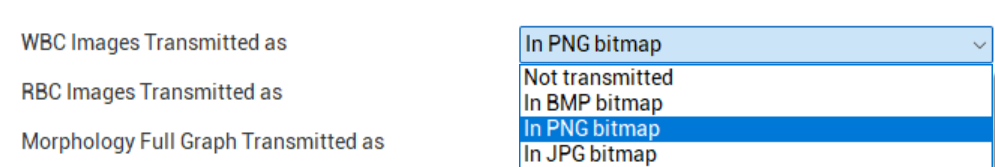
After confirming with the LIS manufacturer’s engineers that the LIS can support receiving image information transmission results and with Mindray engineers that the communication codes and related settings for morphological image results are completed.
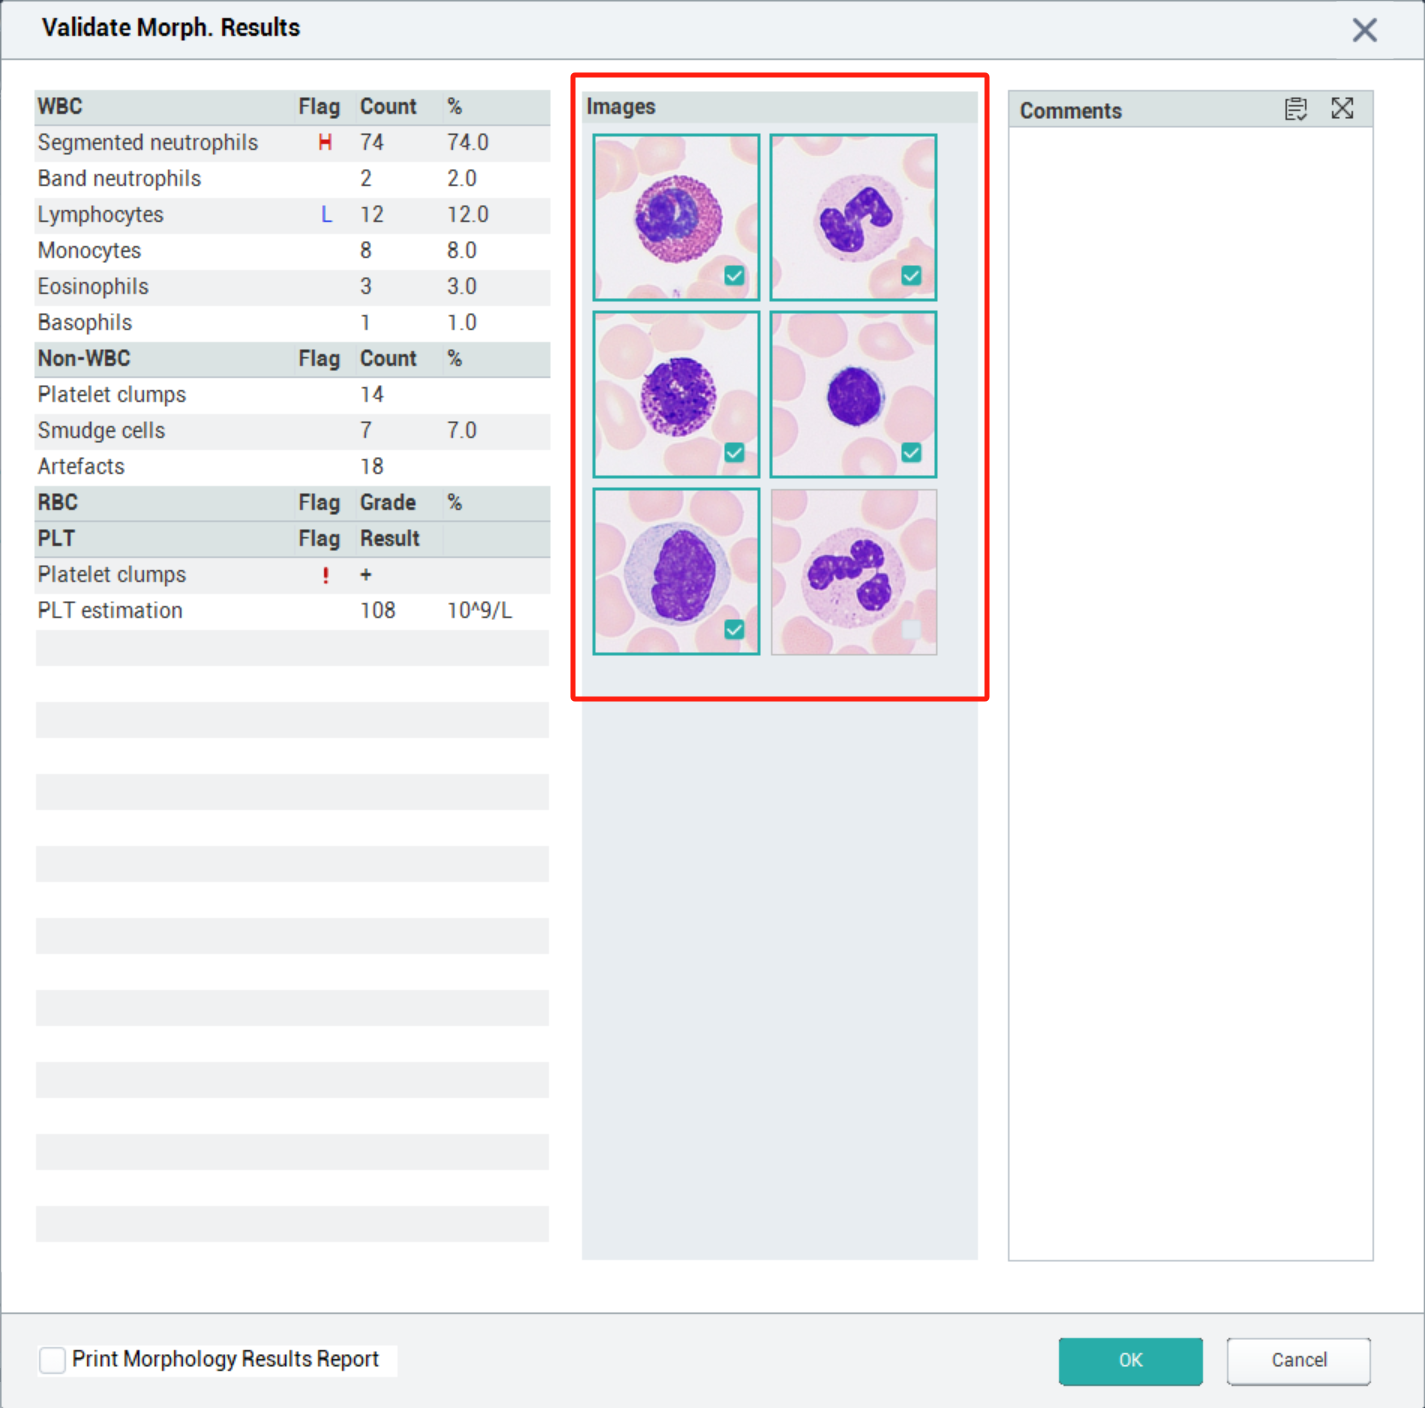
And then you can use the marking function “Flag” ![]() in the cell morphology result review interface to mark the WBC cell images you want to send to the LIS. When you finish reviewing the sample, click the “Validate” function button. The software will prompt you to confirm the results and check the WBC cell images you want to send. After completing the selection, click “OK,” and the software will automatically send the selected cell images to the LIS, allowing you to send the report of morphological cell image results.
in the cell morphology result review interface to mark the WBC cell images you want to send to the LIS. When you finish reviewing the sample, click the “Validate” function button. The software will prompt you to confirm the results and check the WBC cell images you want to send. After completing the selection, click “OK,” and the software will automatically send the selected cell images to the LIS, allowing you to send the report of morphological cell image results.
It should be noted that in the cell morphology result review interface, there is no limit on the number of WBC cells you can mark using the marking function. However, during the check-and-confirm step for sending cell images after review, you can select a maximum of five WBC cell images to send to the LIS.
The morphological results in labXpert software provide standard WBC reference cell images for customers to compare and identify cell morphology. Customers can manually add WBC cell images of validated samples to the reference cells, and these added cell images will not change the algorithm for WBC cell classification and recognition. You can manually add WBC images to the reference cells through the following methods:
- Log in to the labXpert software with the Admin account;
- Complete the review of the morphological results of the sample, and the sample is in the validation state;
- Right click on the WBC image you want to add to the reference cell
- Choose to ‘add as a reference cell’
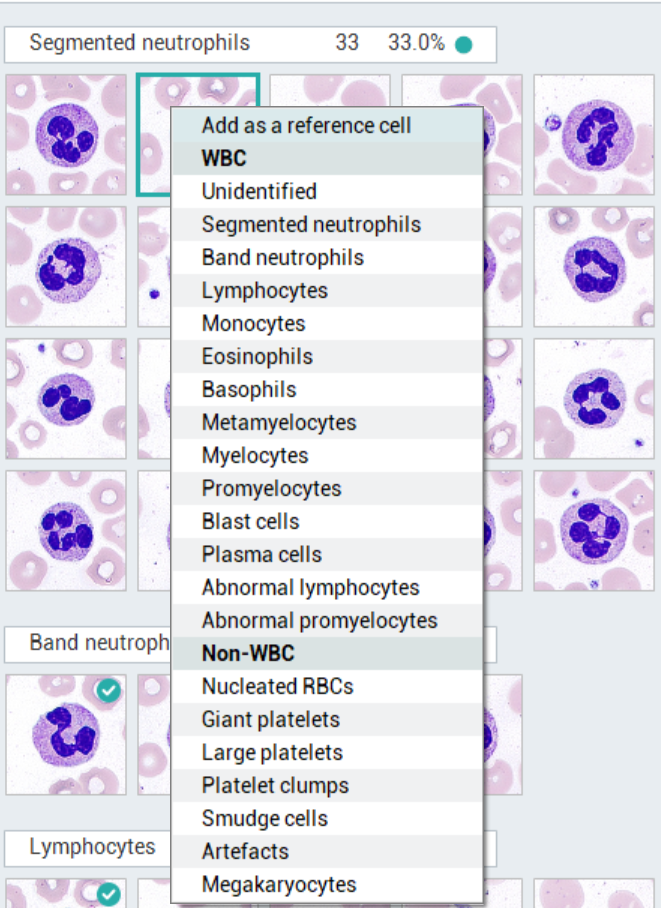
- Addition completed
Smudge cells are a well-described artifact in hematologic morphology that result from the rupture of fragile leukocytes secondary to the process of making the peripheral blood film.
A series of studies have shown smudge cells on blood smears prepared for routine diagnostic purposes is a novel independent factor predicting overall survival in CLL.
How to report smudge cells?
ICSH recommendation: When the nature of the smear cell is apparent, it is recommended that they should be counted as the cell
from which they are derived. Large numbers of smudge cells may be seen in CLL PB. It is recommended that the automated differential be reported if available in this instance but the presence of smudge cells may be commented on in the film report.
How to reduce the percentage of smudge cells?
ICSH recommendation: Smudge cells result from shearing forces on the cells during the spreading of blood films. They are the disrupted nucleus of fragile cells. A repeat film made with one-part albumin added to four parts blood may prevent cell disruption and allow identification of the fragile cells and their inclusion in the WBC differential.