Ultrasound Journal 24 - Multiparametric ultrasound in differential diagnosis of breast mass
2024-04-02
Special thanks to D.E. Galdava, Oncologist, Radiologist, Private Clinic “White Rose”.
Introduction
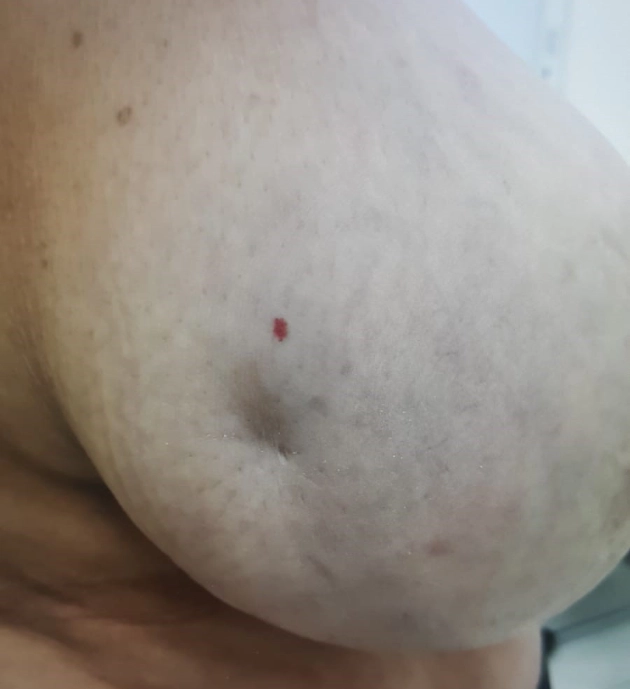
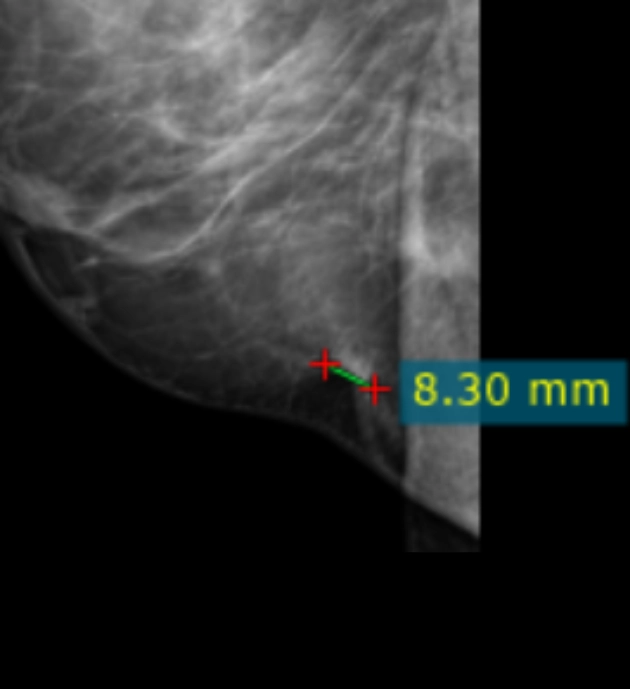
Patient N., 70 years old, complained of skin retraction in the inner quadrant of the right breast (Figure 1A). Digital mammography revealed changes in the breast tissues: in the posterior part in the projection of the lower inner quadrant, the shadow of a nodular mass with X-ray signs of malignant neoplasm and structural reorganization of the surrounding tissues. BI-RADS 5 was diagnosed (Figure 1B). Axillary and supraclavicular lymph nodes were not touched.
B-mode and Color Doppler
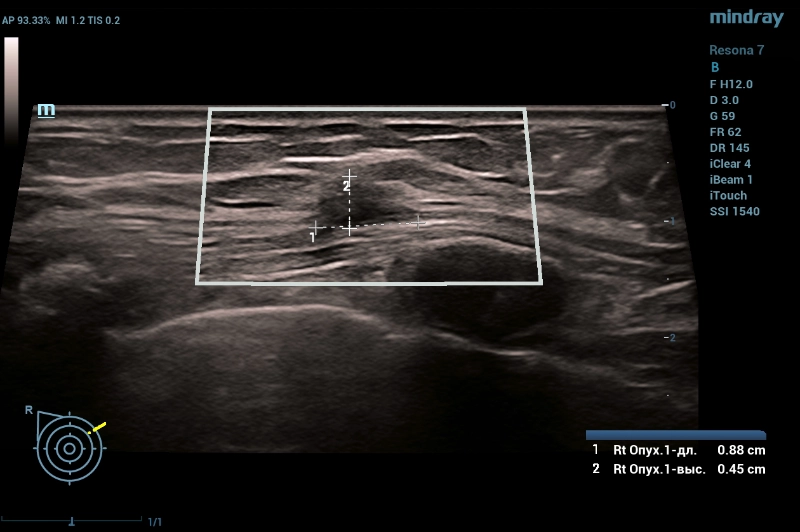
Ultrasound examination was performed on the Resona 7 ultrasound machine (Mindray, China) using a linear high-frequency transducer (up to 18 MHz). A hypoechogenic horizontally oriented hypoechogenic mass (Mass 1) with indistinct spicule-like contour measuring 9x5 mm was detected in the upper-inner quadrant at the 2-o’clock position of the right breast (Figure 2).
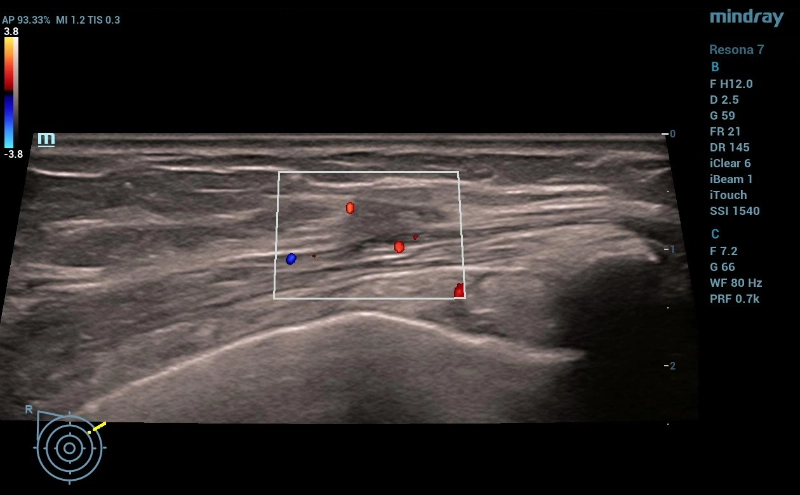
In Color Doppler mode, single color loci localized along the periphery were detected in the focal mass (Figure 3).
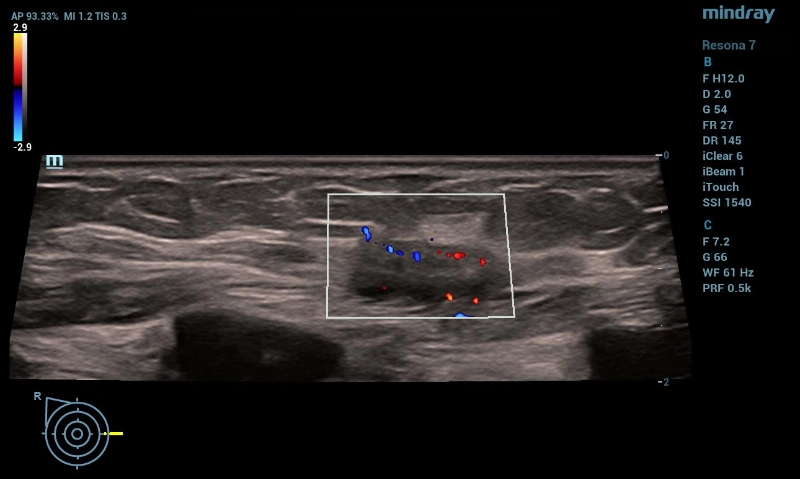
At the border of the internal quadrants at 3 o'clock position of the right breast, a similar mass (Mass 2) of indeterminate orientation 13x6x13 mm was detected (Figure 4 A, B).

In Color Doppler mode, multiple color loci were detected in the focal mass appearing as a chain, repeating the course of the feeding vessel (Figure 5).
Shear Wave Elastography (SWE)
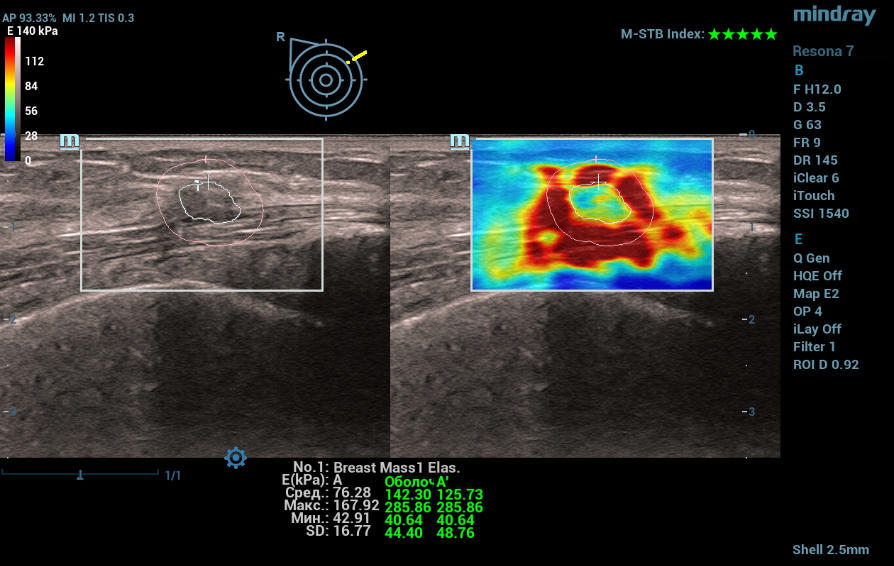
In the SWE mode, both masses were irregularly stained in blue and yellow-green tones with a red rim around the periphery, which may indicate marked tissue infiltration around the masses. When quantified, the mean stiffness - Emean of the masses with infiltration zone was 142.3 kPa and 92.3 kPa (Figure 6 A, B).

Biopsy results
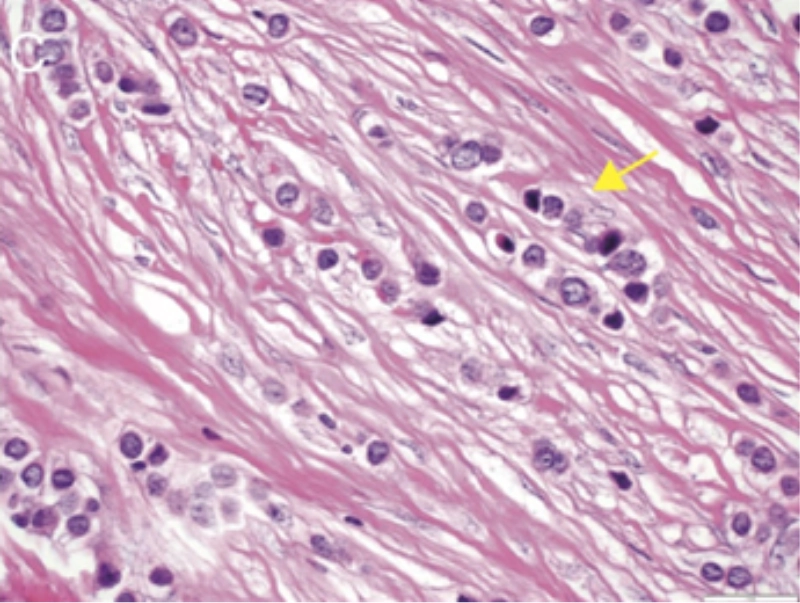
Puncture biopsy specimens contained 4 fragments of breast tissue with tumor overgrowth represented by pseudoglandular and tractional structures of atypical cells with moderately hyperchromic polymorphic nuclei (yellow arrow), prominent nuclei, mitotic figures; separated by fibrous stroma. Nottingham histological grading system for invasive breast cancer (as modified by Elston and Ellis): G2 (2 points (structures) + 2 points (nuclear polymorphism) + 2 points (mitoses)) = 6 points. Conclusion: moderately differentiated invasive lobular carcinoma of the right breast (Figure 7).
Conclusion
Currently, breast cancer ranks first in terms of morbidity and mortality among malignant diseases in women around the world [1].
Ultrasound examination is one of the most common methods for breast tumor screening, but differential diagnosis of focal masses based on B-mode and Doppler is not possible in all cases.
The use of SWE allows to avoid unnecessary biopsies in those cases when the mass is soft relative to the color hardness scale [2]. But there are known cases of false negative results obtained with shear wave elastography. This is caused by the fact that the infiltration zone around the mass is stiffer than the mass itself and prevents the shear wave from penetrating. This phenomenon has been called "soft" artifact [3].
In this clinical example, malignant focal masses in the breast were characterized as soft with a stiff rim with a mean stiffness index of E 142.3 kPa and 92.3 kPa according to the color chart in the shear wave elastography mode.
Thus, ultrasound examination with shear wave elastography increased the reliability of the findings for diagnosis, which was also confirmed by morphological results [4].
References:
[1] Rupali Sood, MPH, Anne F. Rositch, PhD, Delaram Shakoor, MD, Emily Ambinder, MD, Kara-Lee Pool, MD, Erica Pollack, MD, Daniel J. Mollura, MD, Lisa A. Mullen, MD, and Susan C. Harvey, MD. Ultrasound for Breast Cancer Detection Globally: A Systematic Review and Meta-Analysis. J Glob Oncol. 2019 Aug 27. doi: 10.1200/JGO.19.00127
[2] Menezes G.L., Knuttel F.M., Stehouwer B.L., Pijnappel R.M., van den Bosch M.A. Magnetic resonance imaging in breast cancer: A literature review and future perspectives. World J Clin Oncol. 2014 May 10;5(2):61-70. doi: 10.5306/wjco.v5.i2.61.
[3] Richard G Barr, Aaron Engel, Su Kim, Phuong Tran, Annalisa De Silvestri. Improved Breast 2D SWE Algorithm to Eliminate False-Negative Cases. Invest Radiol 2023 Mar 13. doi: 10.1097/RLI.0000000000000972.
[4] Joseph R. Grajo, MD, Richard G. Barr, MD, PhD. Strain Elastography for Prediction of Breast Cancer Tumor Grades. 2014, Journal of Ultrasound in Medicine. doi:10.7863/ultra.33.1.129.