Ultrasound journal 11 - Complementary use of Shearwave Elastography with shell assessment prior to biopsy in the evaluation of Breast mass lesions
Bhagya Piumali de Silva, Aruna Pallewatte, Pandula Hettiarachchi, S.R Constantine The National Hospital of Sri Lanka, Colombo 2023-02-08

Illustration of two case reports
Case Report 1
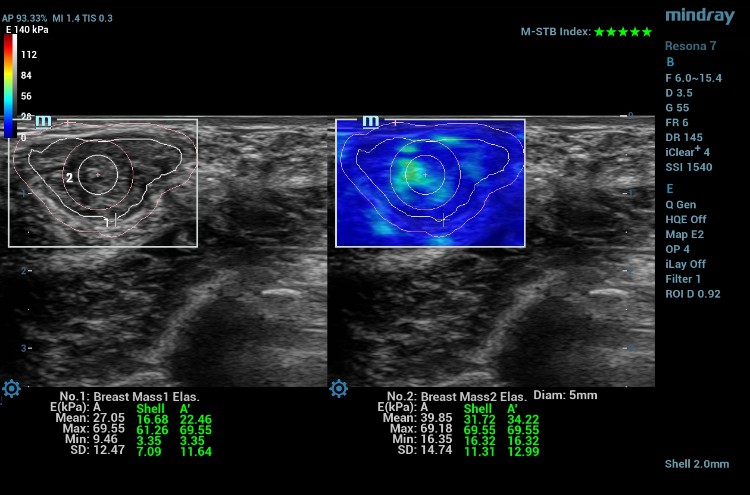
57-year-old female, patient A presented with a left breast lump of 6 months duration. There was a lump measuring 19x15mm in size at the 2 O’clock position of the left breast. B-mode ultrasound categorized this lesion as BIRADS 5. Before performing the biopsy, the patient underwent shear wave elastography (SWE) using L14-3WU (bandwidth frequency = 3.8-15.4 MHz, FOV-50.8mm) linear array transducer of Resona 7 diagnostic ultrasound system by Mindray Medical International, Shenzhen, China.
SWE values were obtained in the following Elastrography Protocol.
- The maximum value in the selected ROI manually along the edge of the lesion
- Mean value in the selected ROI along the edge of the lesion
- The maximum value in the 2mm shell around the lesion
- Mean value in 2mm shell around the lesion
- The maximum value in the lesion + shell
- Mean value in the lesion + shell
- The maximum value in the center of the lesion with a circular ROI measuring 5mm in diameter
- Mean value in the center of the lesion with a circular ROI measuring 5mm in diameter
- The ratio of the lesion to normal breast tissue SWE values

The Maximum and mean values in the selected ROI manually along the edge of the lesion are 97.4 kPa and 24.5 kPa. The maximum value in the 2mm shell around the lesion is 118.7 kPa. The maximum and mean values in the lesion + shell are 118.7 kPa and 30.9kPa. Maximum and minimum values in the center of the lesion with a circular ROI measuring 5mm in diameter are 59.5kPa and 23.8kPa.
Histology Findings
6 core biopsy samples were taken. It showed an invasive carcinoma of the breast, composed of tubular structures, cords, and trabeculae of cells within a desmoplastic stroma. Tubule formation is minimal. The tumor cells have moderately pleomorphic vesicular nuclei. The mitotic count is 4/2 mm2. The cytoarchitectural features place the tumor in Nottingham grade II.

Case 2
21-year female Patient B presented with breast pain in the right breast and was found to have a small lump in the right breast measuring 21x12mm. It was categorized as BIRADS 3 on the ultrasound examination and subjected to shear wave elastography before the biopsy.
SWE findings
The Maximum and mean values in the selected ROI manually along the edge of the lesion are 69.5 kPa and 27 kPa. The maximum value in the 2mm shell around the lesion is 61.2 kPa. The maximum and mean values in the lesion + shell are 69.5kPa and 22.4kPa. Maximum and minimum values in the center of the lesion in a circular ROI measuring 5mm in diameter are 69.18kPa and 39.8kPa.
Histology Findings
6 core biopsies were taken. Sections reveal fibroadenoma composed of slit-like compressed glandular structures lined by a dual population of cells; surrounded by a myxoid stroma. There is no nuclear atypia or mitotic activity in the stroma. No evidence of DCIS or malignancy.

Discussion
Malignant tissue is stiffer than benign breast tissue due to the high proliferative index resulting in high cellular density. This principle is utilized in elastography to identify suspicious lesions. The combination of B-mode and SWE increases the specificity in diagnosis from 61% to 79%, and the positive predictive value from 53% to 67% [1]. Few studies have proven that the tissue adjacent to the lesion showed more stiffness than the lesion itself. They have reported that the peripheral tissue of malignant lesions is typically stiffer than that of benign lesions because the former has abnormal stiff collagen fiber, which is related to cancer fibroblasts, as well as infiltration of cancer cells into the surrounding tissue [2]. Mindray Resona 7 system has introduced an option to measure the shell around the specific ROI. In the Resona 7 system, the cut-off value in differentiating benign and malignant was reported as 98.66 kPa in the measurements where a shell of 2 mm in thickness was included [3]. The two cases show that the elastography values were compatible with the histology findings. The measurements taken in the lesion’s center were incompatible with patient A's histology findings. It may be due to the center of cancer undergoing necrosis and cystic degeneration. Studies have proven tumor active proliferation can lead to local ischemia, necrosis, and cystic changes affecting the average hardness of tissues [4].
Key Points
Hence, we believe that the SWE measurements taken from ROI selection in manual tracing along the edge of the lesion provide accurate results.
The SWE measurements taken from an ROI selected manually along the edge of the lesion (the shell) can be useful in identifying malignant lesions complementary to routine B mode ultrasonography.
Consent
Informed written consent was taken from the patients to perform elastography and publish the case.
The authors wish to acknowledge the help of Ms. Bhagya Abayarathna Application Specialist, Mindray South Asia.
References
[1] Berg WA, Cosgrove DO, Doré CJ, Schäfer FK, Svensson WE, Hooley RJ, Ohlinger R, Mendelson EB, Balu-Maestro C, Locatelli M, Tourasse C, Cavanaugh BC, Juhan V, Stavros AT, Tardivon A, Gay J, Henry JP, Cohen-Bacrie C; BE1 Investigators. Shear-wave elastography improves the specificity of breast US: the BE1 multinational study of 939 masses. Radiology. 2012 Feb;262(2):435-49. doi: 10.1148/radiol.11110640. PMID: 22282182.
[2] Xiao Y, Zeng J, Zhang X, Niu LL, Qian M, Wang CZ, Zheng HR, Zheng RQ. Ultrasound strain elastography for breast lesions: Com- puter-aided evaluation with quantifiable elastographic features. J Ultrasound Med 2017;36:1089–1100.
[3] Hakki Muammer KARAKAS. Technical Considerations and Practical Guidelines in Breast Imaging
[4] Ya- Yun Cui, Nian-and He, Xian-Jun Ye, Lei Hu, Li Xie, Wen Zhong and Chao- Xue Zhang (2022) Evaluation of tissue stiffness around lesions by sound touch shear wave elastography in breast malignancy diagnosis.