Analysis of the False Low Result for Abnormally High Triglyceride Sample
Dr. Jiang Xiaojun 2021-01-08

Deputy Laboratory Chief
The First Affiliated Hospital of Shaoyang University, Hunan Province, China
Due to the changing diet structure and unhealthy lifestyle, hyperlipidemia has become a common phenomenon in today’s society among patients, particularly those who show high triglycerides (TG) and chylomicrons (CM). This also brings considerable interference to biochemistry testing. In clinical practice, the interference of lipemia can be evaluated by serum index and TG concentration.
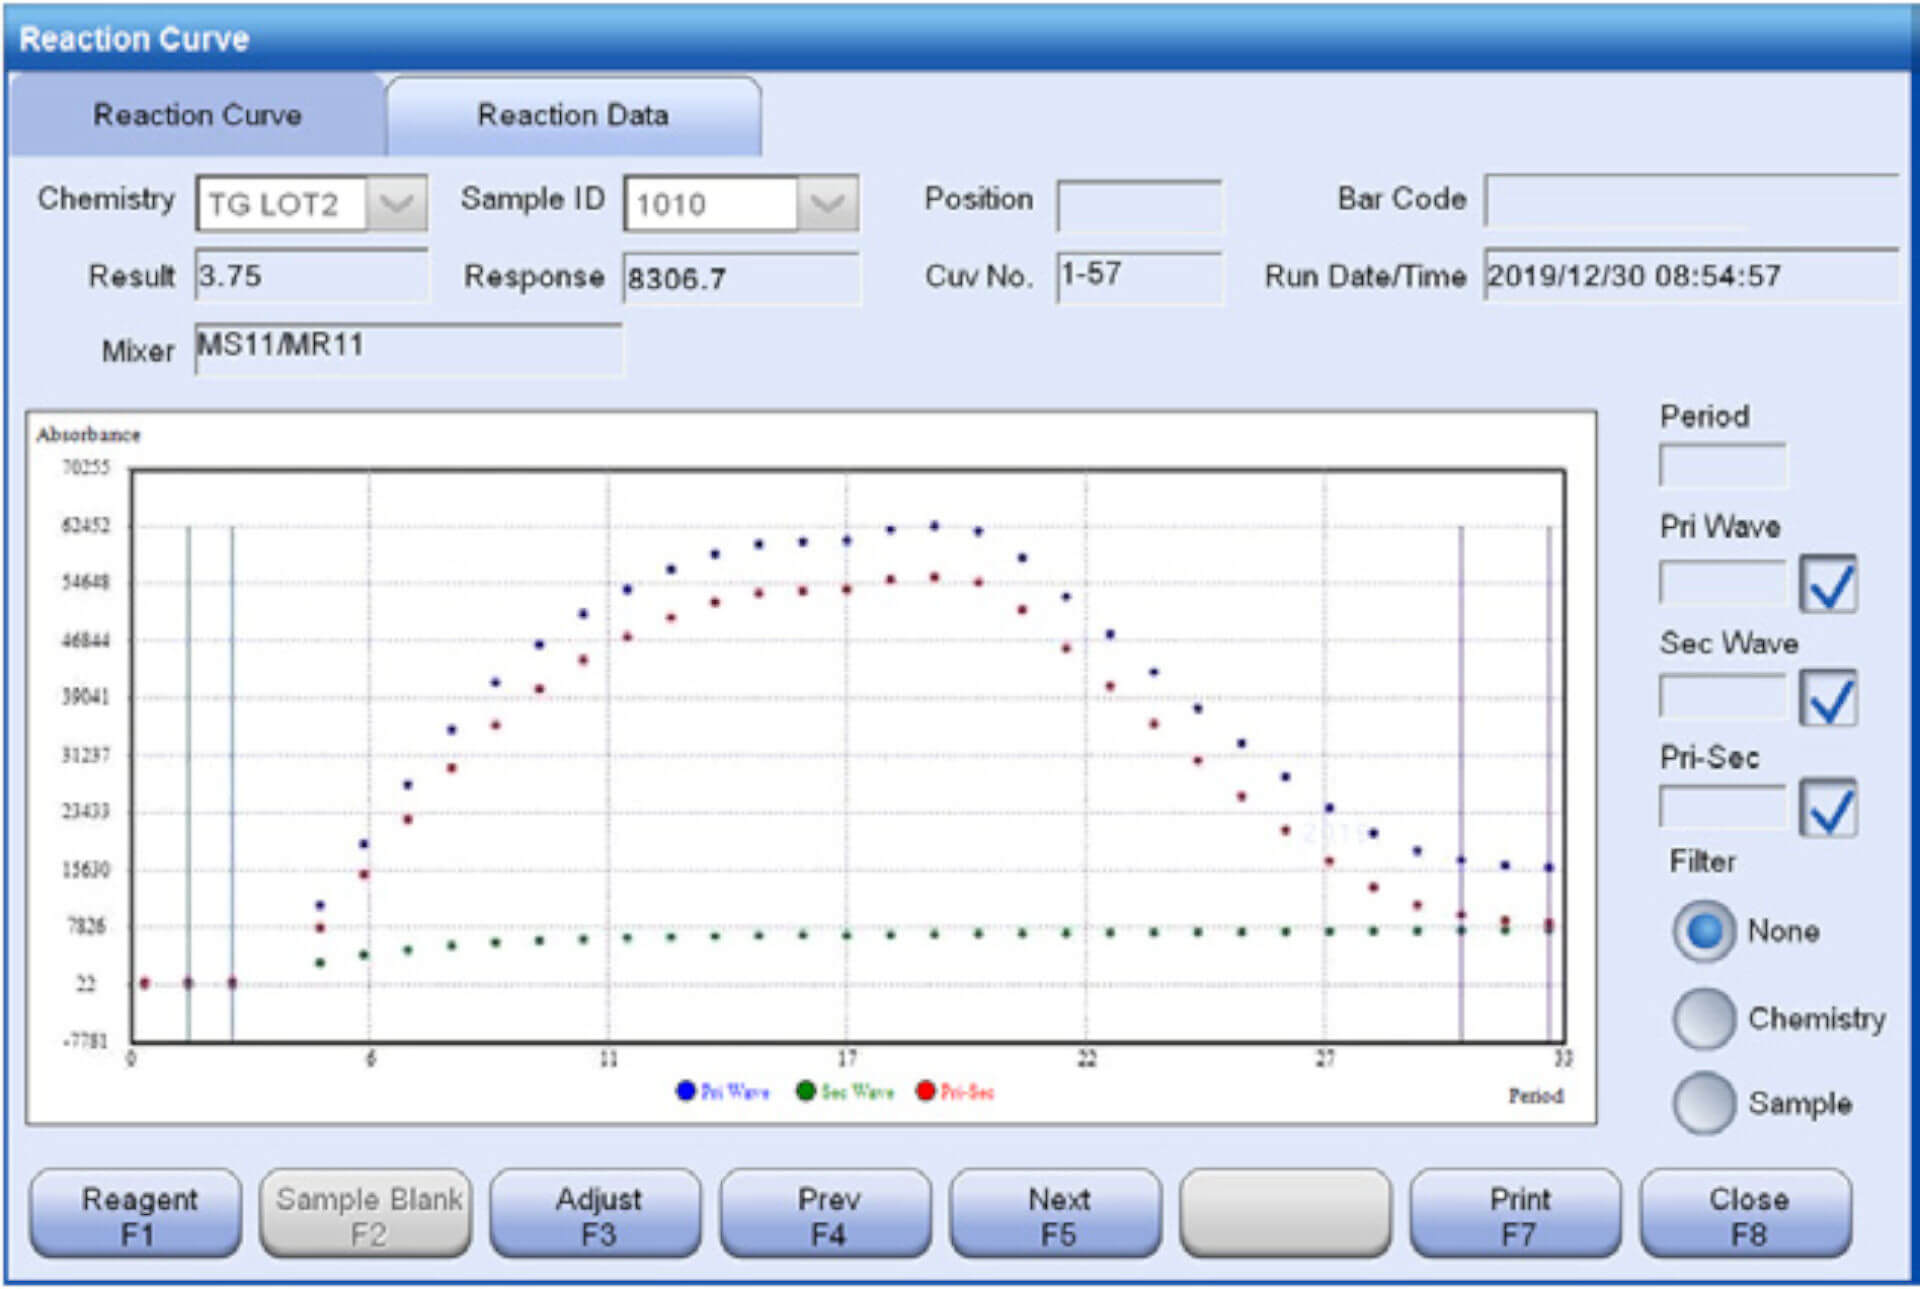
In this case, the sample was sent to the laboratory for detecting the cause of abdominal pain of the patient and the system gave an alarm on abnormal absorbance. The TG result was only 3.75mmol/L, which was inconsistent with the sample status that was already marked as severe lipemia. We checked the reaction curve of TG and found that the optical density (OD) value of the reaction quickly rose to the top and then began to decrease. When the reaction reached the end, the OD value was only one sixth of its peak value, and that caused the false low result. After manual sample dilution, the result was 67.2 mmol/L, which was much higher than the linearity upper limit 20mmol/L of TG. We also rerun this sample on another detection system, the testing result was still much lower than the actual concentration.
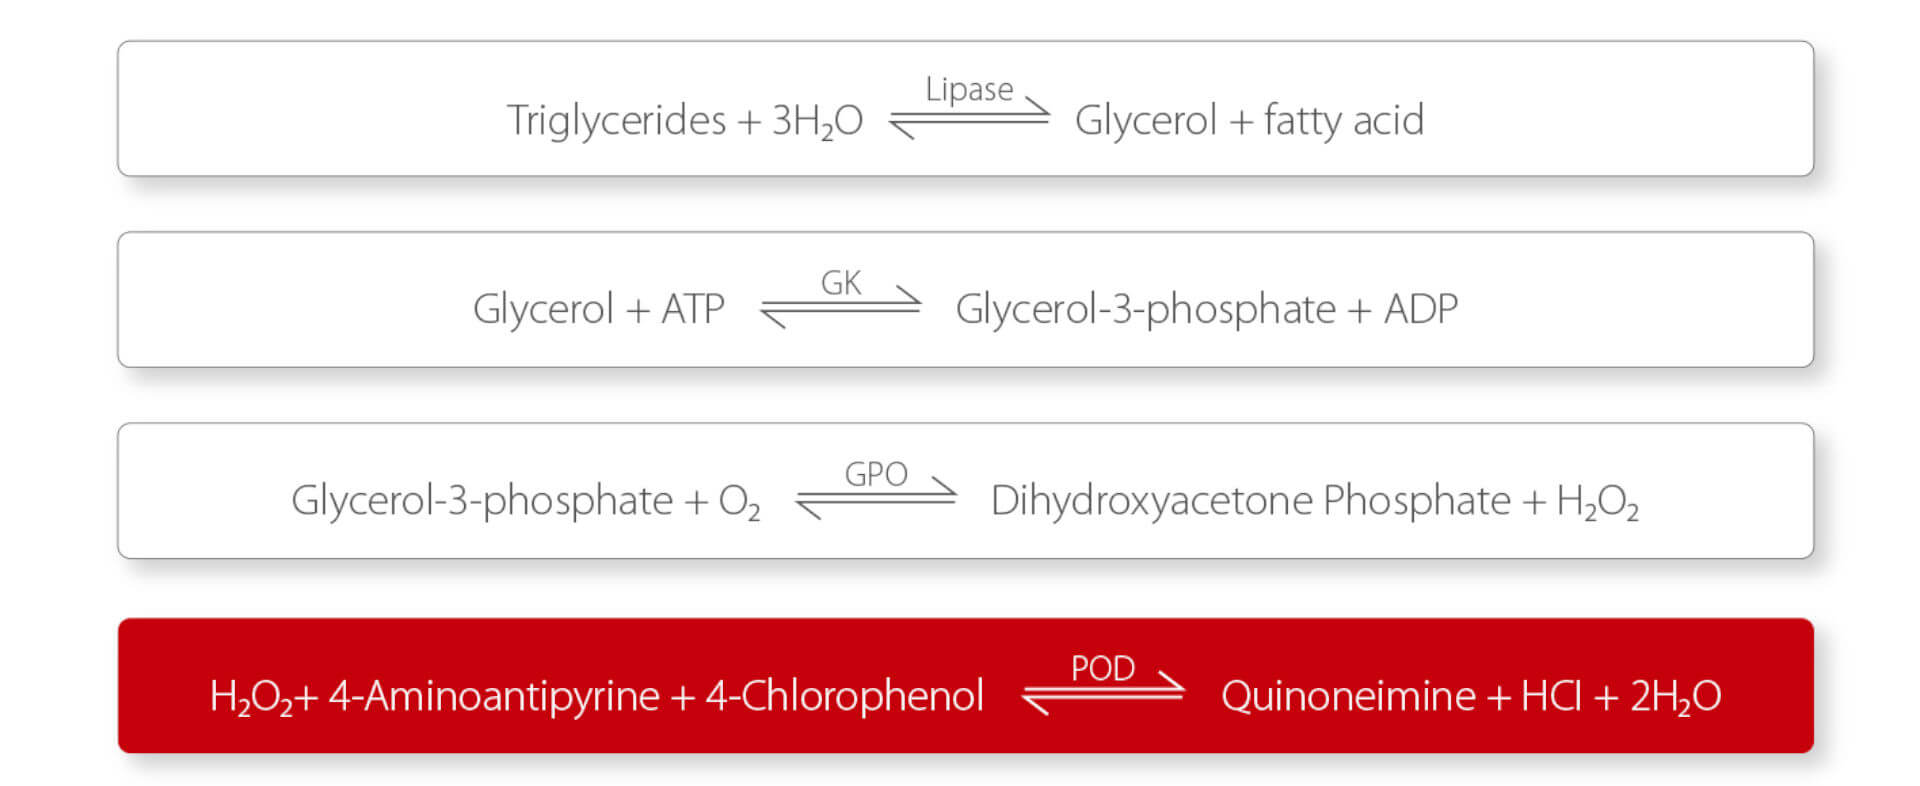
Endpoint colorimetric method is used for TG assay. When the reaction equivalence point is reached, all the analytes convert into products, and the absorbance no longer rises or falls.The measuring principle showed in the TG reagent instruction manual is oxidase method involving “Trinder” color reaction (Figure 2).
Due to the extremely high TG concentration in the sample, the reaction speed will be very fast. The oxygen in the reaction solution is quickly exhausted and new oxygen fails to be dissolved into solution and join the reaction timely. Under such circumstance, the reaction will be stagnated or even reversed, which will lead to an inaccurate result (usually lower than actual concentration). Mindray integrated chemistry system can monitor the reaction curve in the real time, and give an intelligent alarm flag when it finds abnormal absorbance characteristics. After the identification, the system will trigger the auto-dilution function, and produce more reliable results.
High TG concentration cases are quite common in clinical practice. If the laboratory technician fails to find the abnormalities in time, wrong results may be reported. Even if the abnormal reaction curve can be detected by experienced person, repeated review and manual rerun with dilution will lower the work efficiency. So the intelligent alarm flag plus auto rerun function in the integrated testing system is of great benefit to result reliability and laboratory efficiency.
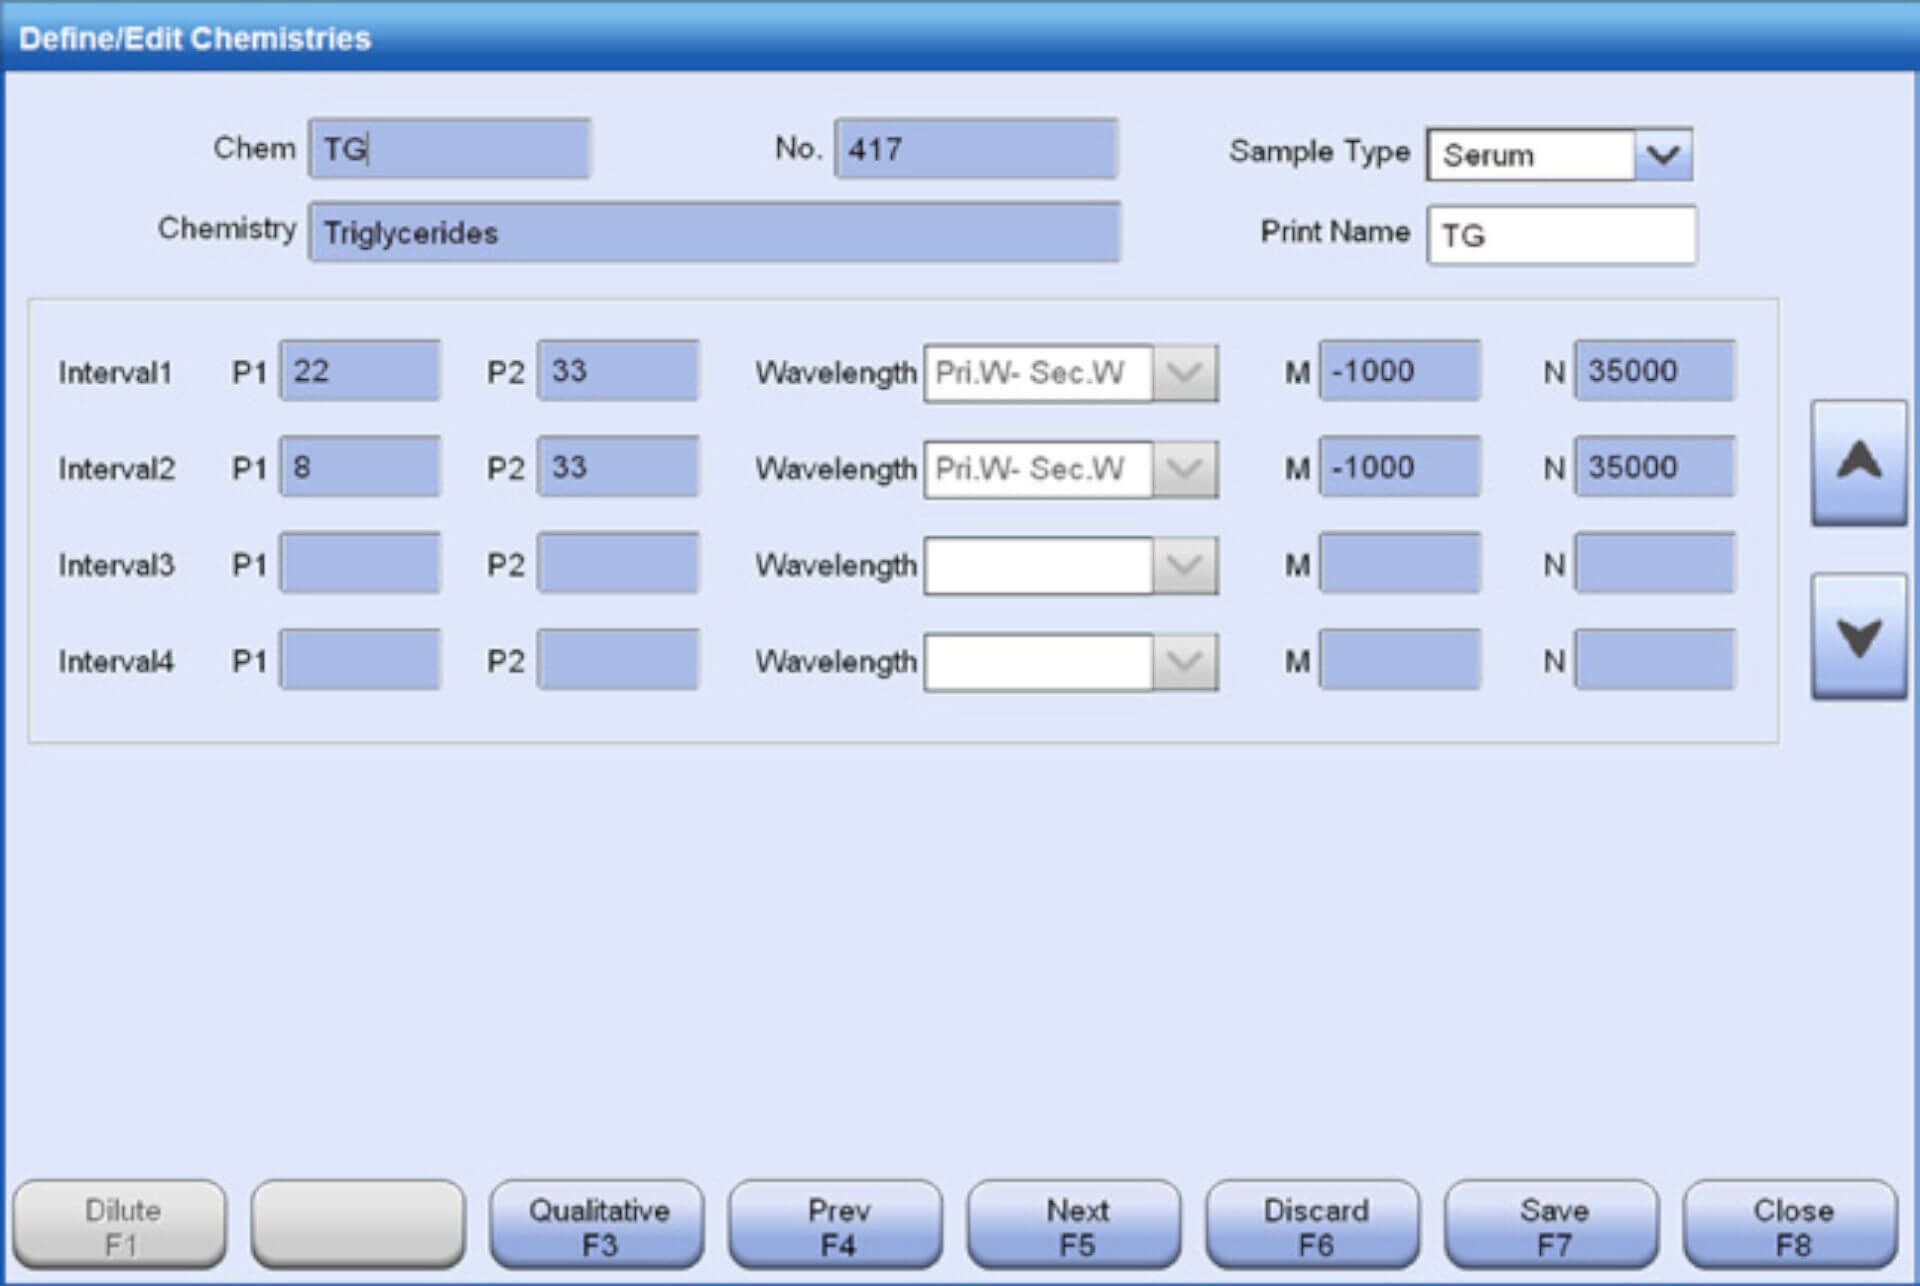
For the integrated close chemistry system, some indexes have been inbuilt in the software, which can help the system monitor the reaction curve and give an assessment for abnormal reaction. In the software interface in figure 3, P1 and P2 refer to sequence number of absorbance points on the reaction curve. The software can automatically calculate the value of P2 minus P1 (P2-P1). M and N respectively refer to the minimum and maximum of the value (P2-P1) for identifying the existence of abnormalities in the reaction process.
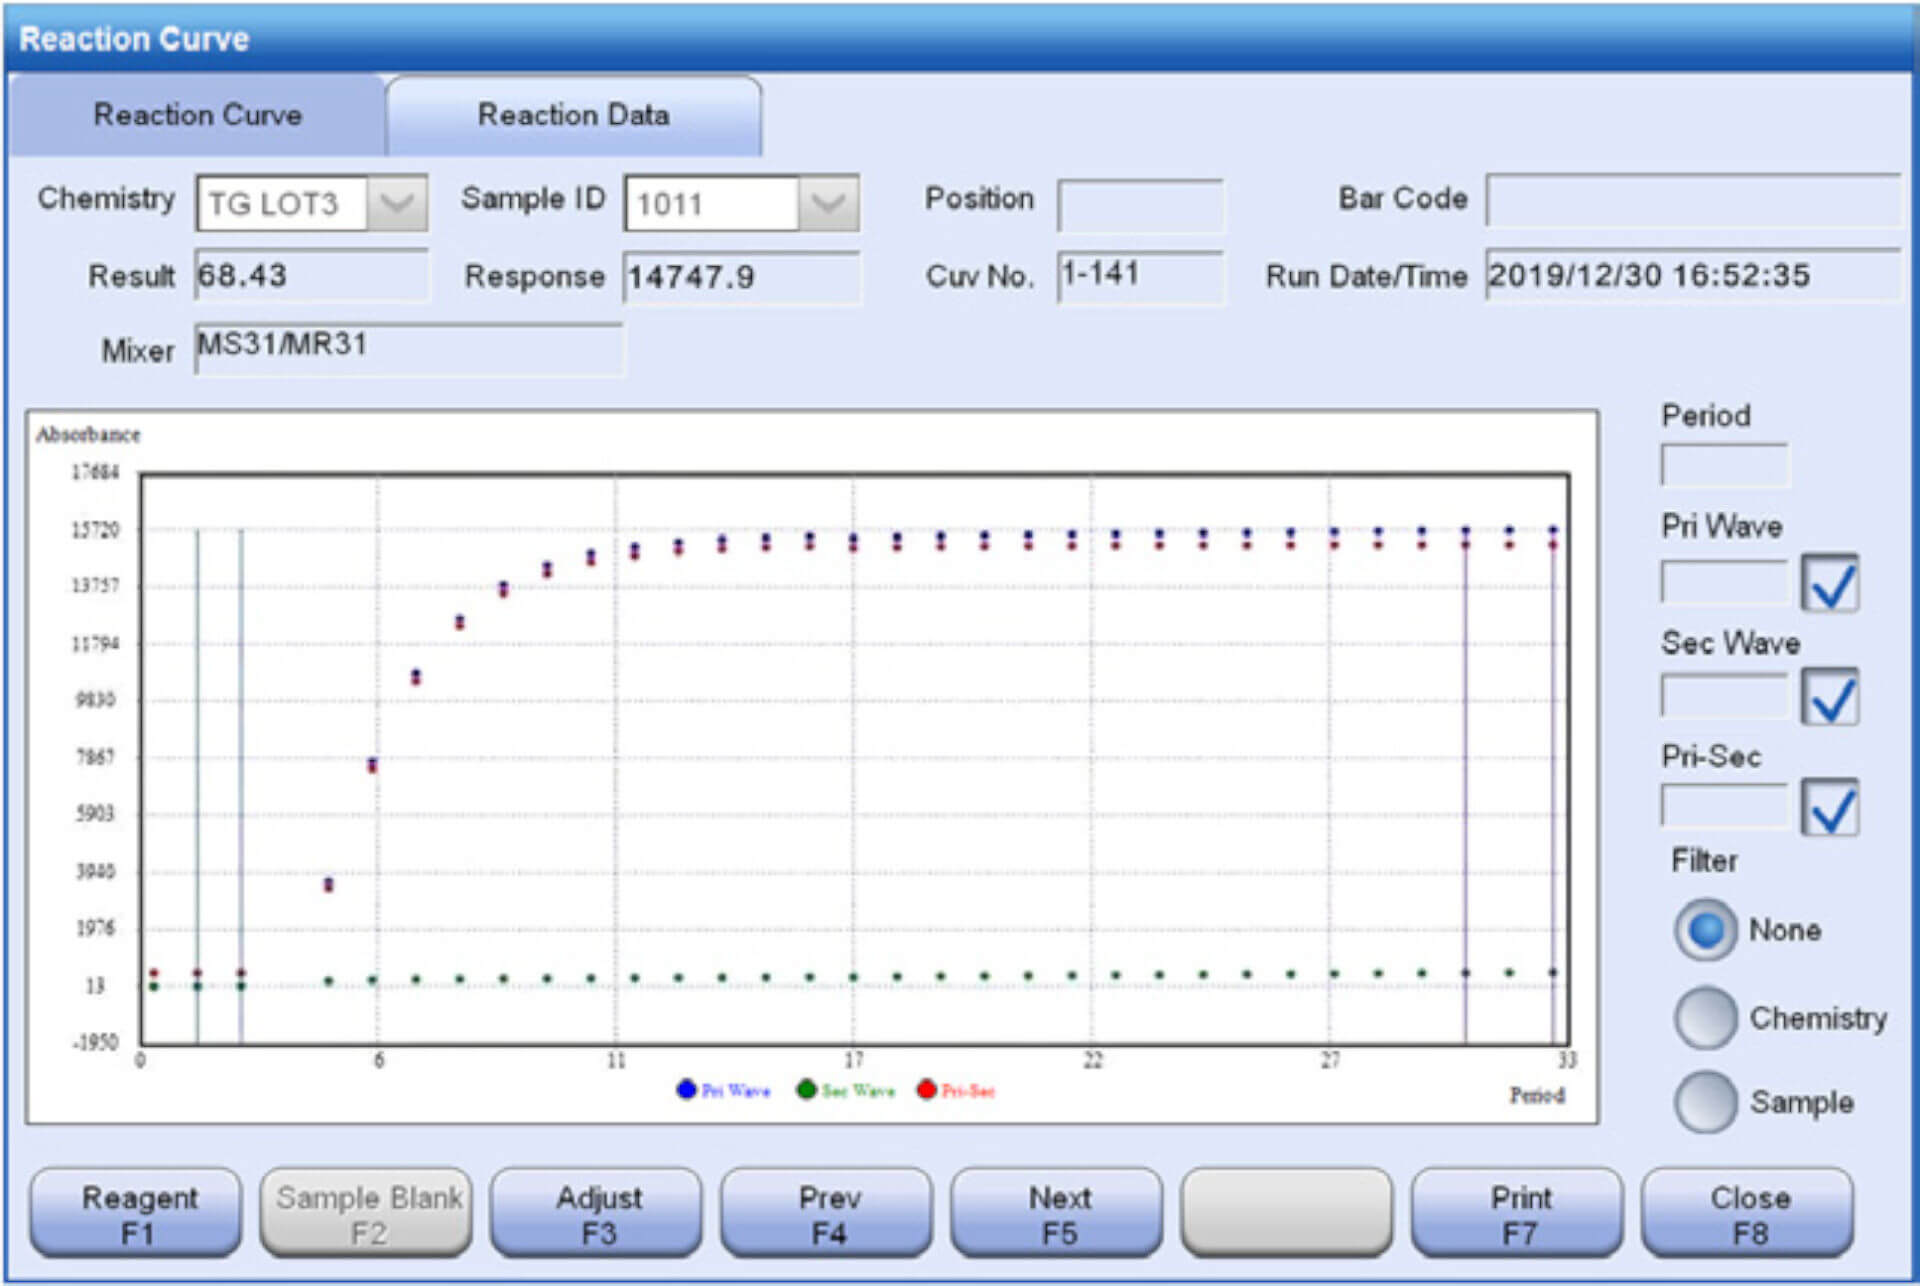
Through the reaction curve monitoring and algorithm function, the analyzer can automatically identify the abnormalities and give an “RE” flag, and subsequently trigger the auto-dilution function. After automatic dilution and rerun, the reaction curve returned to normal and the test result was 68.4 mmol/L, which is in line with the result obtained from manual dilution (Figure 4).
The integrated AAA testing system has inbuilt a powerful testing database in the software. For example, application data (R1/R2/S volume, reaction time, Pri./Sec. wavelength, linearity range, rerun rule) and reaction monitoring data (carry-over pairs, substrate depletion check rule, Trinder reaction check rule, and Hook effect check rule). The powerful database can make the testing system more efficient and intelligent, and more user-friendly. Taken together, the integrated AAA chemistry system can greatly improve the efficiency, shorten the TAT time, reduce potential risk of errors and increase both clinical and patient satisfaction.