Respiratory Mechanics Monitoring during Mechanical Ventilation for Severe COVID-19
Mindray 2020-03-31
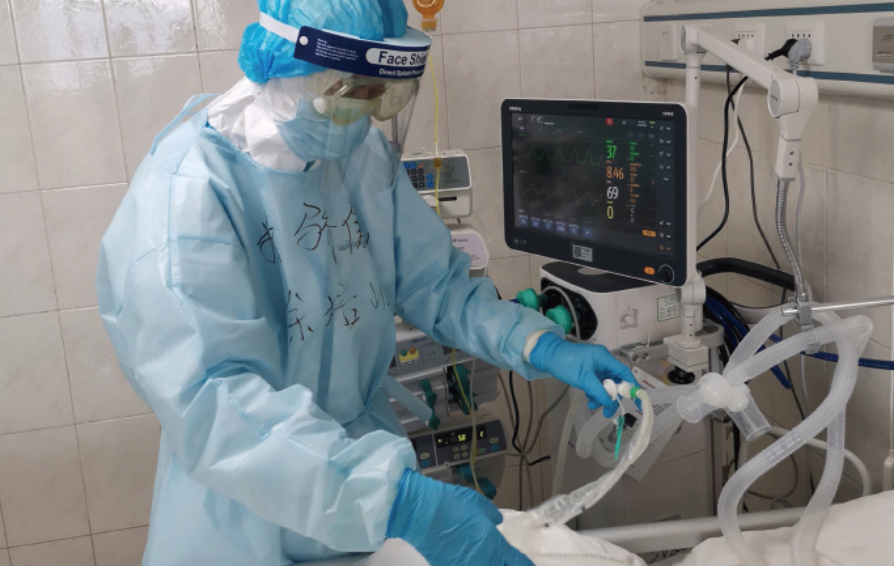
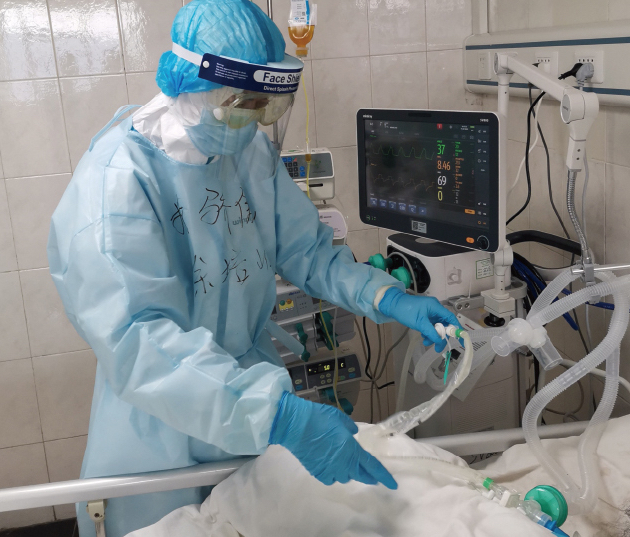
The virus that causes COVID-19 is infecting people and spreading easily from person to person. Cases have been detected in most countries worldwide and community spread is being detected in a growing number of countries. On March 11, the COVID-19 outbreak was characterized as a pandemic by the WHO. Reported illnesses have ranged from very mild (including some with no reported symptoms) to severe, including illness resulting in death. While information so far suggests that most COVID-19 illness is mild, and serious illness occurs in 16% of cases [1]. As the respiratory system changes based on the severity level, the monitoring of the respiratory mechanic become a vital part of guiding therapeutic strategies and interventions for patients with COVID-19.
COVID-19 Research and the Importance of Respiratory Mechanics Monitoring
Recent autopsy of deceased COVID-19 patients found that their lung tissue had obvious bleeding and necrotic damage with thick mucus attached deeply in airways. Pathophysiological changes in the lungs can be shown in respiratory mechanics (airway resistance and lung compliance)[2,3]. Therefore, monitoring the respiratory mechanics would help to give early warnings when the patient’s health begins to deteriorate. Therefore, it is highly relevant in guiding ventilation strategies and parameter adjustments for the patient.
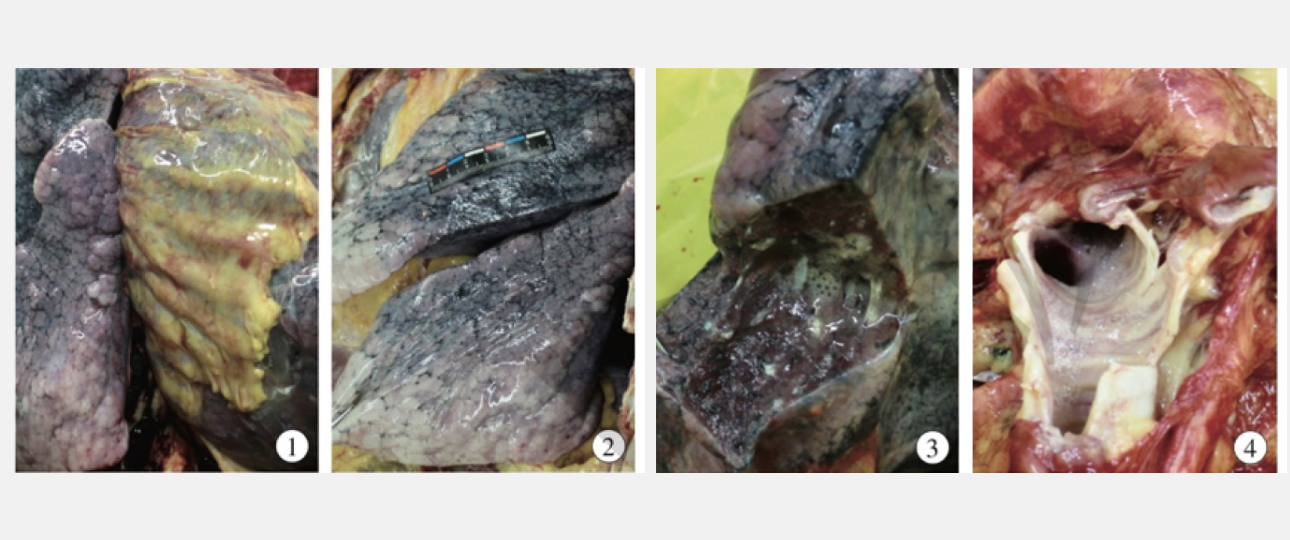
Fig. 1 Right pleura thickening extensive adhesion with the right lung;
Fig. 2 Gray white patchy lesions in the left lung;
Fig. 3 Gray white viscous fluid overflow in the lung section, and fiber bands can be seen;
Fig. 4 White foam mucus in the trachea;
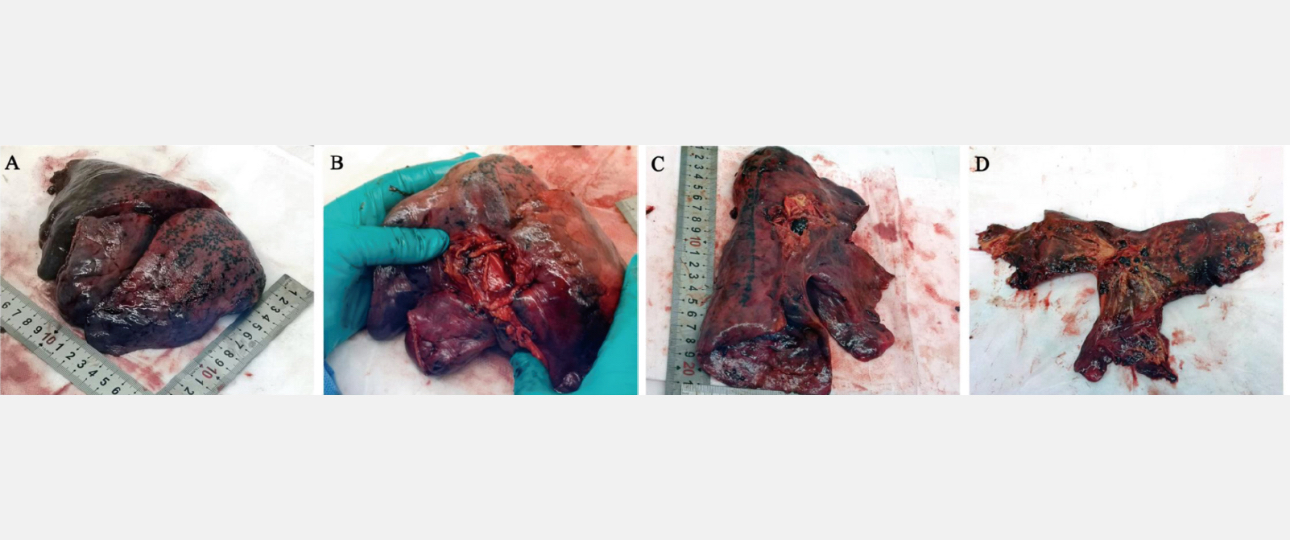
Lung gross examination. Gross morphology of the right lung (A and B) and of the left lung (C and D). Hemorrhagic necrosis is obvious in the outer edge of pulmonary right lobe.
Respiratory Mechanics Monitoring of COVID-19 Patients
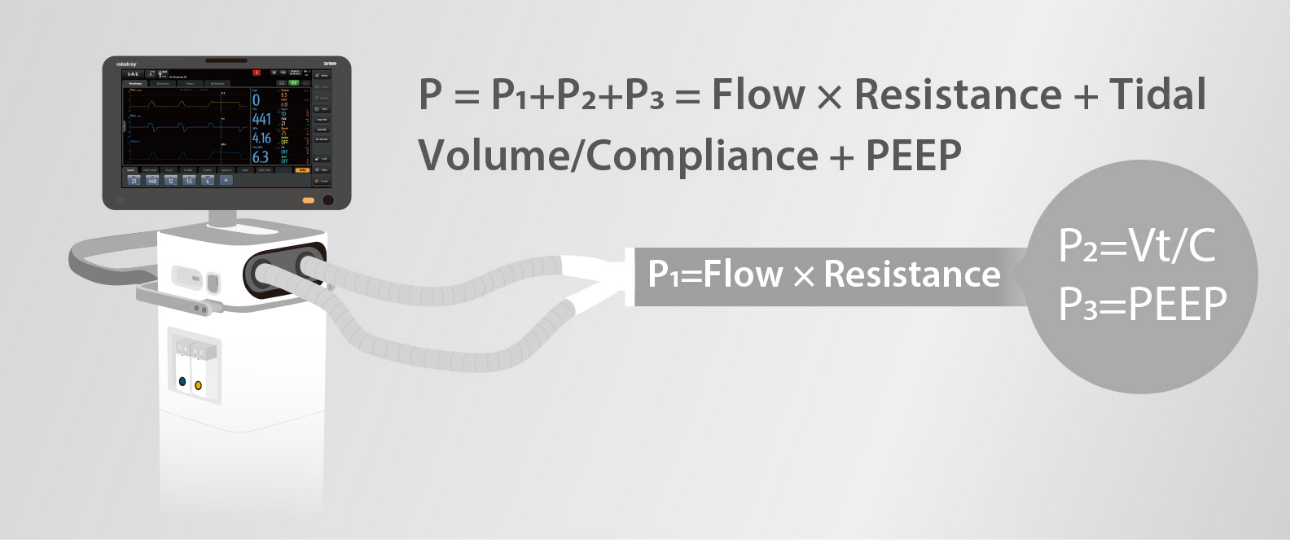
Respiratory mechanics are based on Newtonian mechanics, as expressed in the equation of motion. To implicit its simplest form, the respiratory system can be modeled as a balloon connected to a tube. The balloon represents the elastic element (lungs and chest wall), and the tube represents the resistive element (conducting airways). The pressure provided by the ventilator need to overcome the resistance of the airway, to expand the lung with tidal volume and provide with a given PEEP (positive end-expiratory pressure, a positive pressure at the end-of-breath).
1. Airway resistance
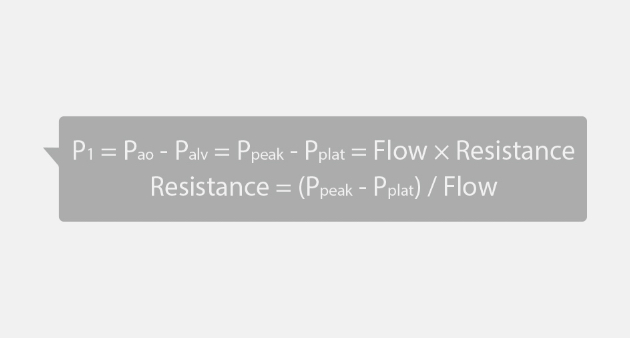
Measurement technique for Pplat :
- Under Volume Control Ventilation mode, ensure patient have weak or do not have spontaneous breath
- Square flow (constant flow)
- Inspiratory pause/hold for at least 3s
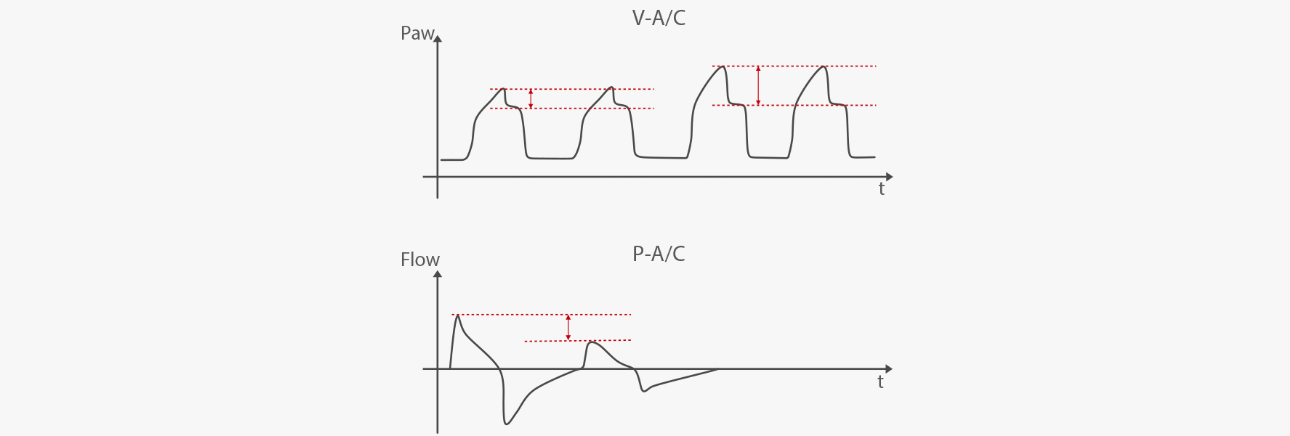
The normal airway resistance of patients under invasive mechanical ventilation is approximately 5-10 cmH₂O/L/s. When the airway resistance exceeds this range, it means that the airway resistance is too high. Clinicians must be vigilant about the possibilities of causes such as sputum or bronchospasm. Increased airway resistance would have typical waveforms (see the charts):
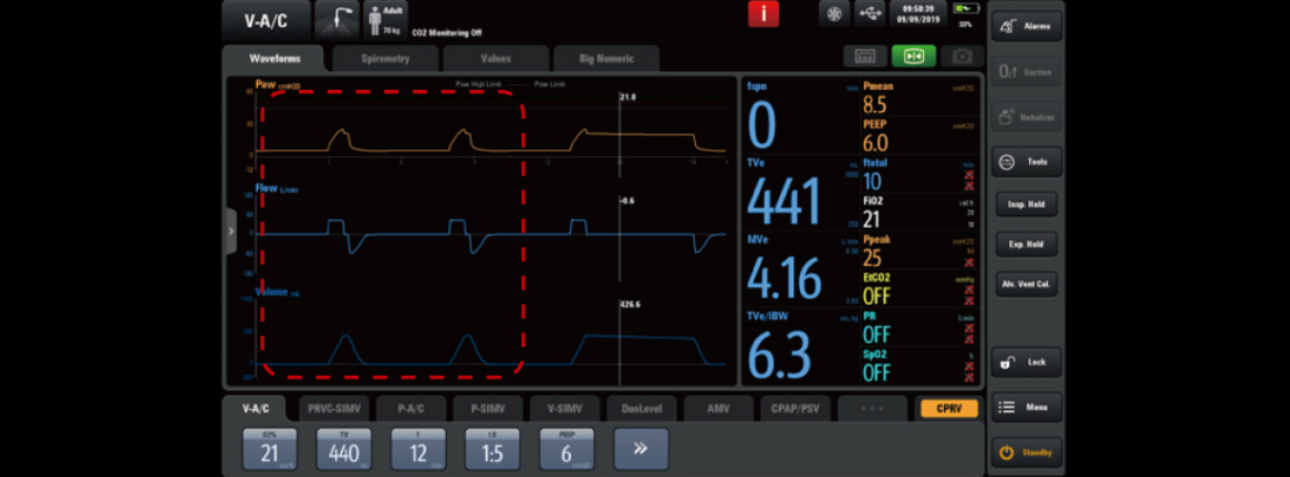
Under V-A/C mode, when the airway resistance increases, the ventilator pressure-time curve shows an increase in peak pressure and an increase in Ppeak - Pplat as well.
Under P-A/C mode, when the airway resistance increases, the flow-time curve shows a decrease in peak flow, which may result in decrease of tidal volume.
2. Compliance
The compliance of the respiratory system mainly reflects the elastic resistance. The compliance refers to the volume change produced by a unit of pressure. During invasive ventilation, when the patient do not have spontaneous breath, the tidal volume (Vt) generated by the driving pressure (DP) can indicate the compliance of the patient's respiratory system.

Generally speaking, DP > 12 cmH₂O may increase the risk of lung injury and mortality. Pplat generally≤30cmH₂O is used as a protective lung strategy [4,5]. It should also be noted when calculated compliance of the respiratory system, the PEEP in the formula is not the ventilator setting, but the PEEPtotal (end-expiratory alveolar pressure)
Measurement technique for PEEPtotal :
- Under weak or no spontaneous breathing
- Expiration pause/hold for at least 2-3s
- If there is no air trapping, PEEPtotal = PEEP
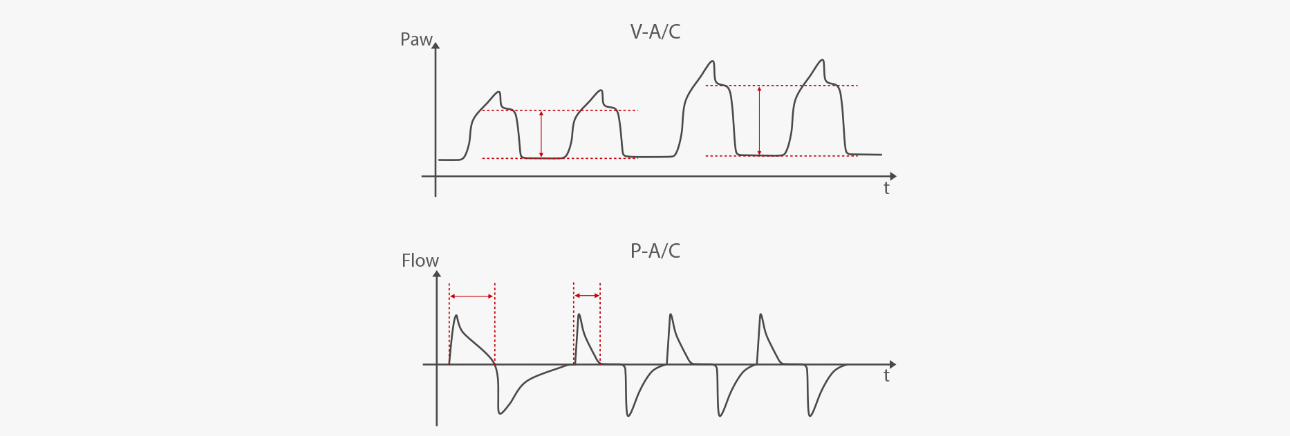
For healthy adult, the compliance of the respiratory system is approximately 100ml/cmH₂O, and the value of patients under mechanical ventilation will be lower, usually around 60ml/cmH₂O. When the patient's compliance is reduced, it means that there are restrictive factors within the lungs, such as pulmonary edema, atelectasis, pulmonary consolidation, chest wall disease, pleural effusion, pneumothorax, etc. Decrease in respiratory compliance would often show waveforms like as the following.
During the V-A/C mode, when the compliance decreases, the ventilator’s pressure-time curve shows an increase in peak pressure and Pplat-PEEP increases.
During P-A/C mode, when the compliance decreases, the ventilator flow-time curve shows a reduction in the effective inspiratory time and therefore a reduction in tidal volume.
3. Conclusion
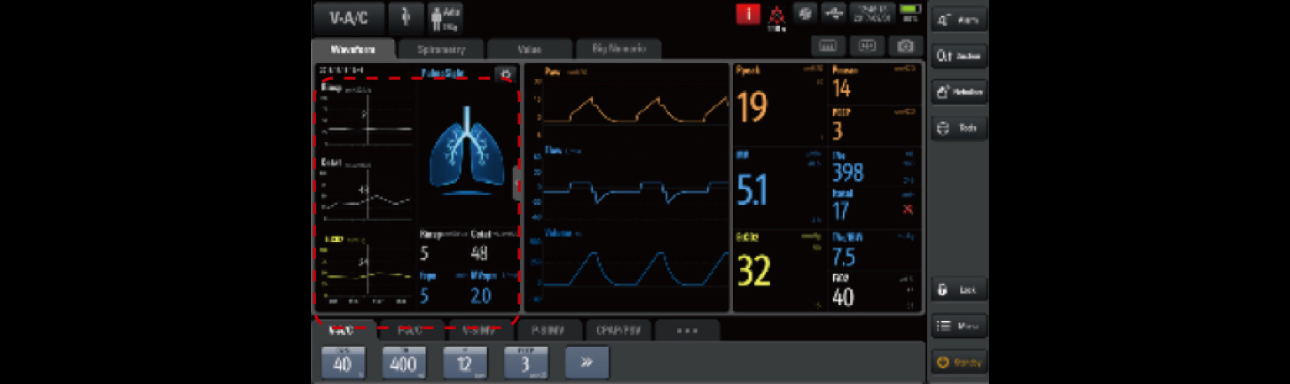
What have been discussed above are typical ways of measuring airway resistance and compliance in clinical setting. The measurement requirements are more precise, and the patient's condition can be analyzed according to the change of respiratory mechanics. The SV600 and SV800 ventilator's PulmoSight can intuitively display patient’s lungs based on changes in pressure, flow, and volume, so that the patient's respiratory mechanics can be monitored with real-time feedback. This allows clinicians to quickly detect changes patient's lung status and respond accordingly to conditions such as increases/decrease resistance, increase/decrease compliance, hyperventilation/hypoventilation, and if the patient shows spontaneous breathing.
Reference:
[1] Wei-jie Guan, et al. Clinical Characteristics of Coronavirus Disease 2019 in China. N Engl J Med 2020
[2] Liu Liang et al, Gross examination report of a COVID-19:Decease autopsy, Journal of Forensic Medicine, February 2020, Vol.36, No.1
[3] Luo, W.; Yu, H.; Gou, J.; Li, X.; Sun, Y.; Li, J.; Liu, L. Clinical Pathology of Critical Patient with Novel Coronavirus Pneumonia (COVID-19). Preprints 2020, 2020020407
[4] Amato et al, Driving Pressure and Survival in the Acute Respiratory Distress Syndrome.N Engl J Med 2015; 372:747-755
[5] Gattinoni et al, Driving pressure and mechanical power: New targets for VILI prevention. Ann Transl Med 2017;5(14):286